Open Access
Fig. 4
Download original image
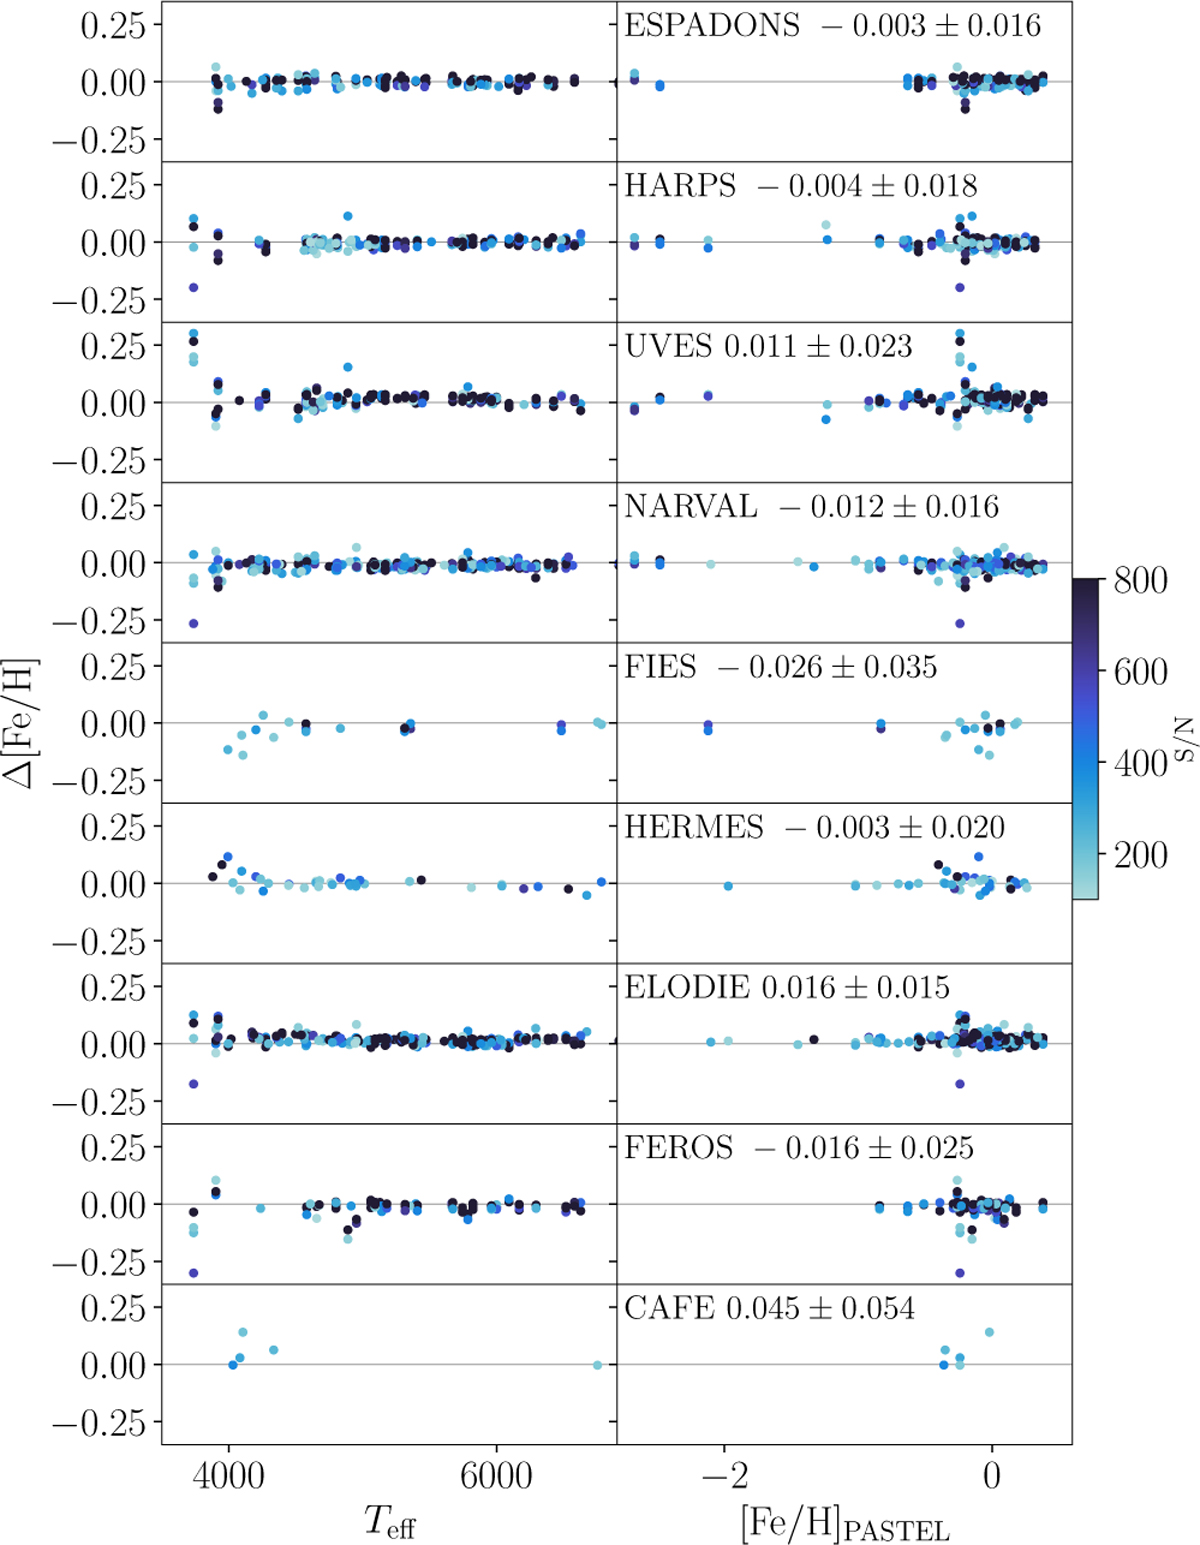
Difference in Fe abundance per instrument (computed as [Fe/H]mean−[Fe/H]instr) as a function of effective temperature (left) and PASTEL [Fe/H] (right). The colour depicts the S/N of the spectra. The average and spreads of the differences for stars above 4000 K are written in each panel.
Current usage metrics show cumulative count of Article Views (full-text article views including HTML views, PDF and ePub downloads, according to the available data) and Abstracts Views on Vision4Press platform.
Data correspond to usage on the plateform after 2015. The current usage metrics is available 48-96 hours after online publication and is updated daily on week days.
Initial download of the metrics may take a while.