Fig. A.1.
Download original image
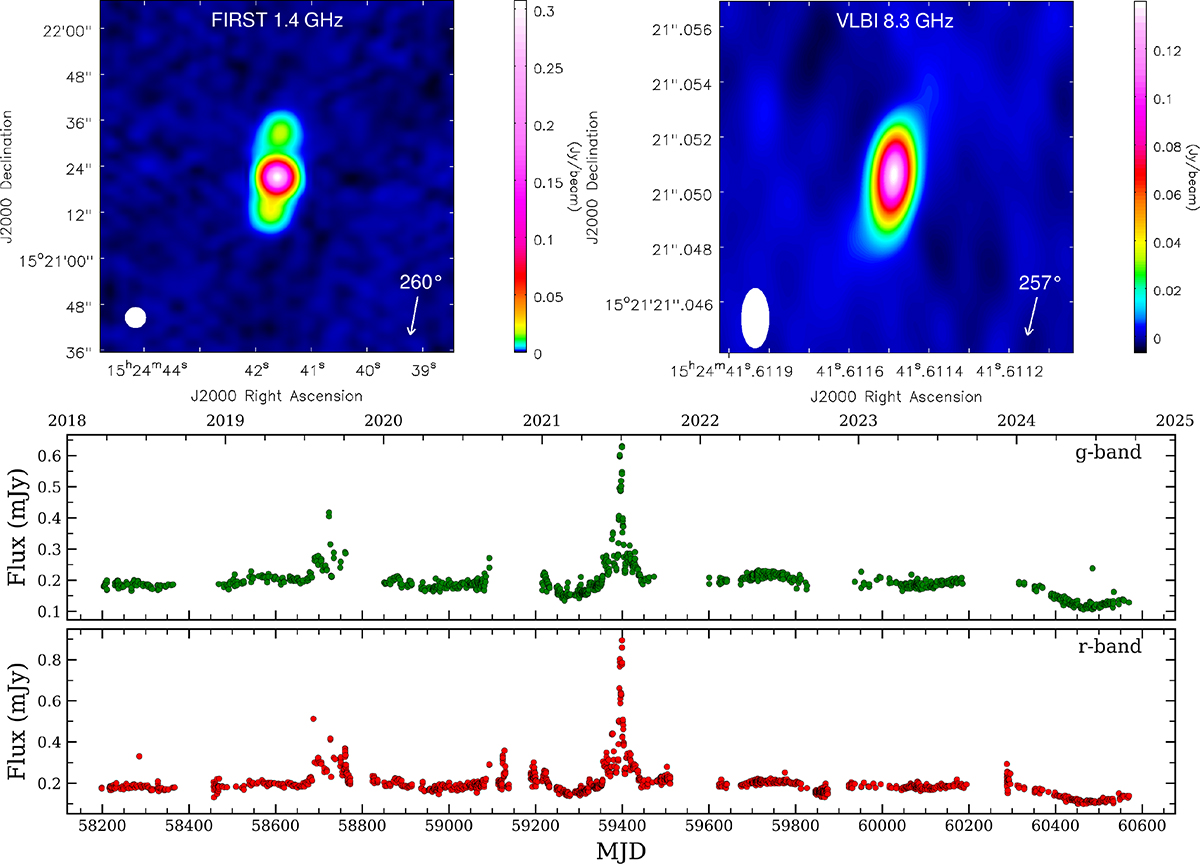
Source 5BZQ J1524+1521. Top left: 1.4 GHz image from FIRST, showing the jet inclination at the kpc scale. Top right: VLBI image at 8.3 GHz, showing the jet inclination at the pc scale. Middle: Optical light curve in the g band, retrieved from the ZTF database. Bottom: Optical light curve in the r band, retrieved from the ZTF database.
Current usage metrics show cumulative count of Article Views (full-text article views including HTML views, PDF and ePub downloads, according to the available data) and Abstracts Views on Vision4Press platform.
Data correspond to usage on the plateform after 2015. The current usage metrics is available 48-96 hours after online publication and is updated daily on week days.
Initial download of the metrics may take a while.