Open Access
Fig. 3.
Download original image
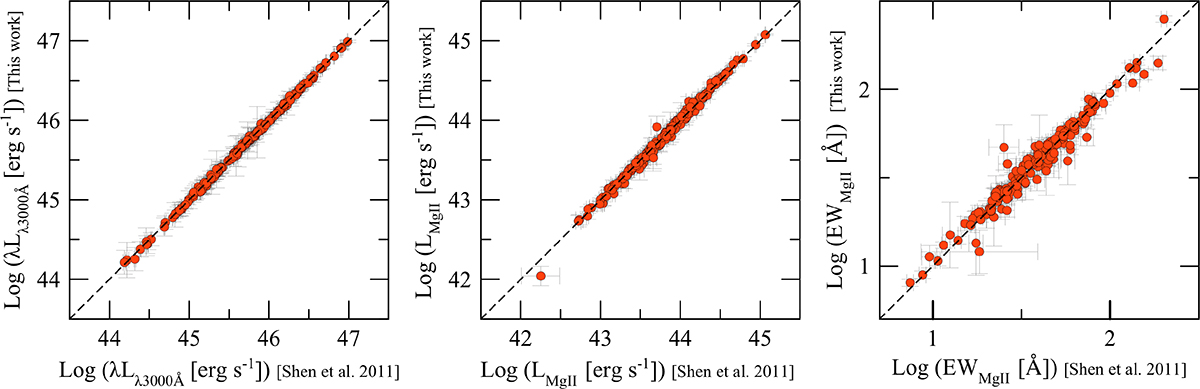
Comparison between the measurements (for the common sources) performed in this work and in S11, for the 3000 Å continuum luminosity (left panel), the Mg II λ2798 Å emission line luminosity (middle panel), and the Mg II λ2798 Å equivalent width (right panel). The dashed line represents y = x.
Current usage metrics show cumulative count of Article Views (full-text article views including HTML views, PDF and ePub downloads, according to the available data) and Abstracts Views on Vision4Press platform.
Data correspond to usage on the plateform after 2015. The current usage metrics is available 48-96 hours after online publication and is updated daily on week days.
Initial download of the metrics may take a while.