Open Access
Fig. 5.
Download original image
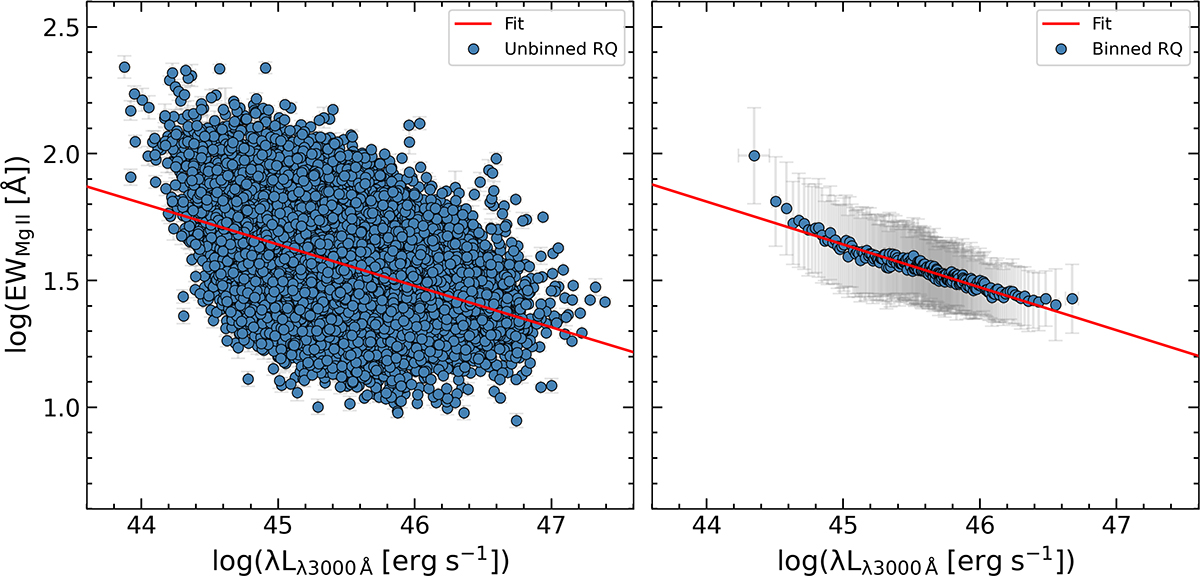
Relationship between the 3000 Å continuum luminosity and the equivalent width of the Mg II λ2798 Å emission line for the RQ control sample, with the unbinned data shown in the left panel and the binned data in the right panel. The solid red line in both panels represents the fitted relation obtained for each dataset.
Current usage metrics show cumulative count of Article Views (full-text article views including HTML views, PDF and ePub downloads, according to the available data) and Abstracts Views on Vision4Press platform.
Data correspond to usage on the plateform after 2015. The current usage metrics is available 48-96 hours after online publication and is updated daily on week days.
Initial download of the metrics may take a while.