Open Access
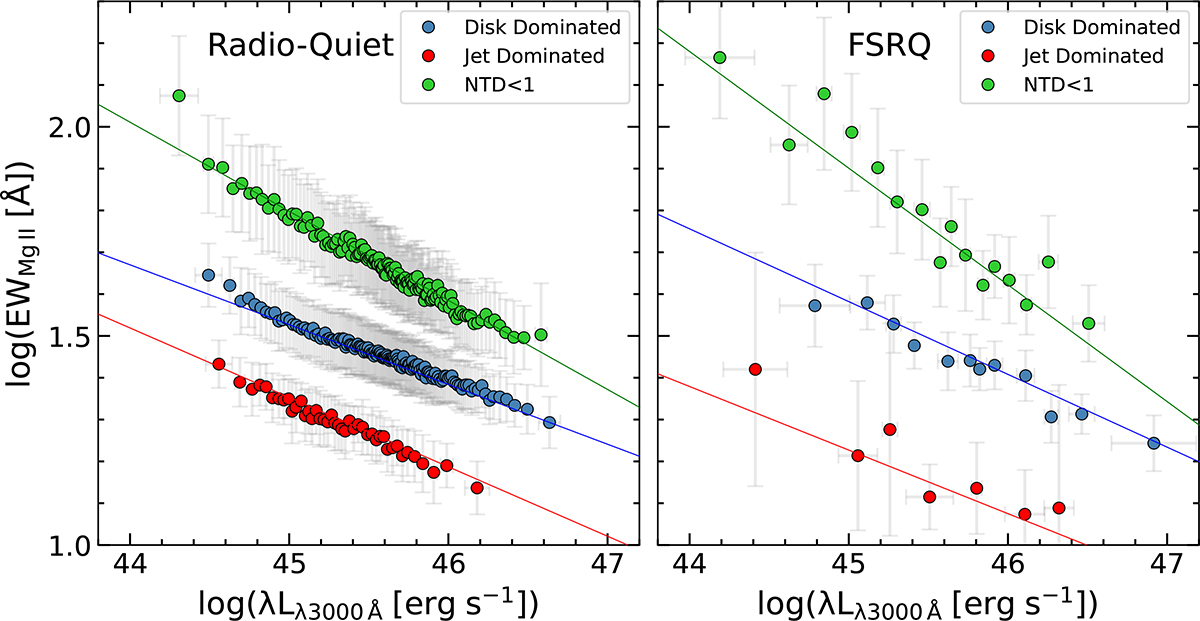
Fig. 9.
Download original image
BE for the 3000 Å continuum and the Mg II λ2798 Å emission line, using binned data, for disk-dominated (DD) sources (blue), jet-dominated (JD) sources (red), and objects with NTD < 1 (green). The left panel displays the BE for the RQ sources, while the right panel shows it for the FSRQ sources.
Current usage metrics show cumulative count of Article Views (full-text article views including HTML views, PDF and ePub downloads, according to the available data) and Abstracts Views on Vision4Press platform.
Data correspond to usage on the plateform after 2015. The current usage metrics is available 48-96 hours after online publication and is updated daily on week days.
Initial download of the metrics may take a while.