Fig. 1
Download original image
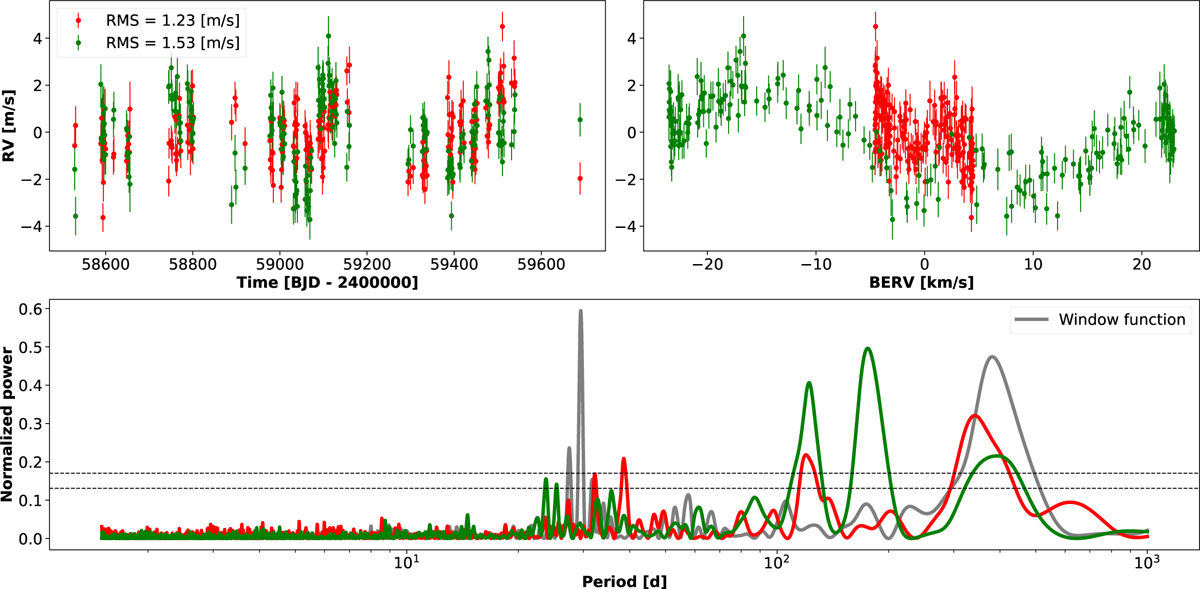
Simulation results when telluric residuals were injected at a 3 ± 1% level. Top: resulting RV time series from the simulations in time (left) and BERV (right) spaces. Bottom: their respective GLS periodograms. The RVs computed with a wide and narrow BERV coverage are indicated in red and green, respectively. The significance levels of FAP = 10−3 and FAP = 10−5 are indicated by the solid and dashed horizontal lines, respectively. The gray line in the periodogram corresponds to the window function.
Current usage metrics show cumulative count of Article Views (full-text article views including HTML views, PDF and ePub downloads, according to the available data) and Abstracts Views on Vision4Press platform.
Data correspond to usage on the plateform after 2015. The current usage metrics is available 48-96 hours after online publication and is updated daily on week days.
Initial download of the metrics may take a while.