Fig. 2
Download original image
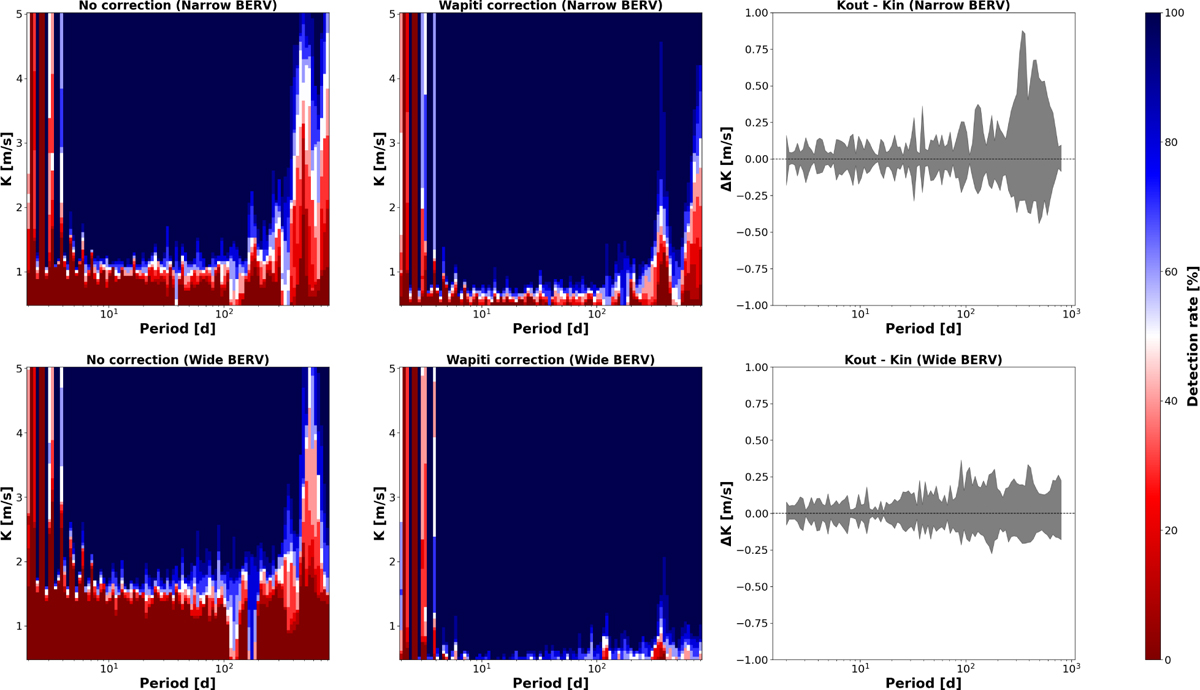
Left: detection maps showing the percentage of recovered injected signals as a function of period and semi-amplitude for the narrow and wide BERV coverages. Middle: same detection tests after applying the wapiti correction. Right: difference between the recovered and injected K values (ΔK = Kout − Kin) at 1 m s−1, with the shaded area indicating one standard deviation. The color bar indicates the detection rate in percent.
Current usage metrics show cumulative count of Article Views (full-text article views including HTML views, PDF and ePub downloads, according to the available data) and Abstracts Views on Vision4Press platform.
Data correspond to usage on the plateform after 2015. The current usage metrics is available 48-96 hours after online publication and is updated daily on week days.
Initial download of the metrics may take a while.