Fig. A.1
Download original image
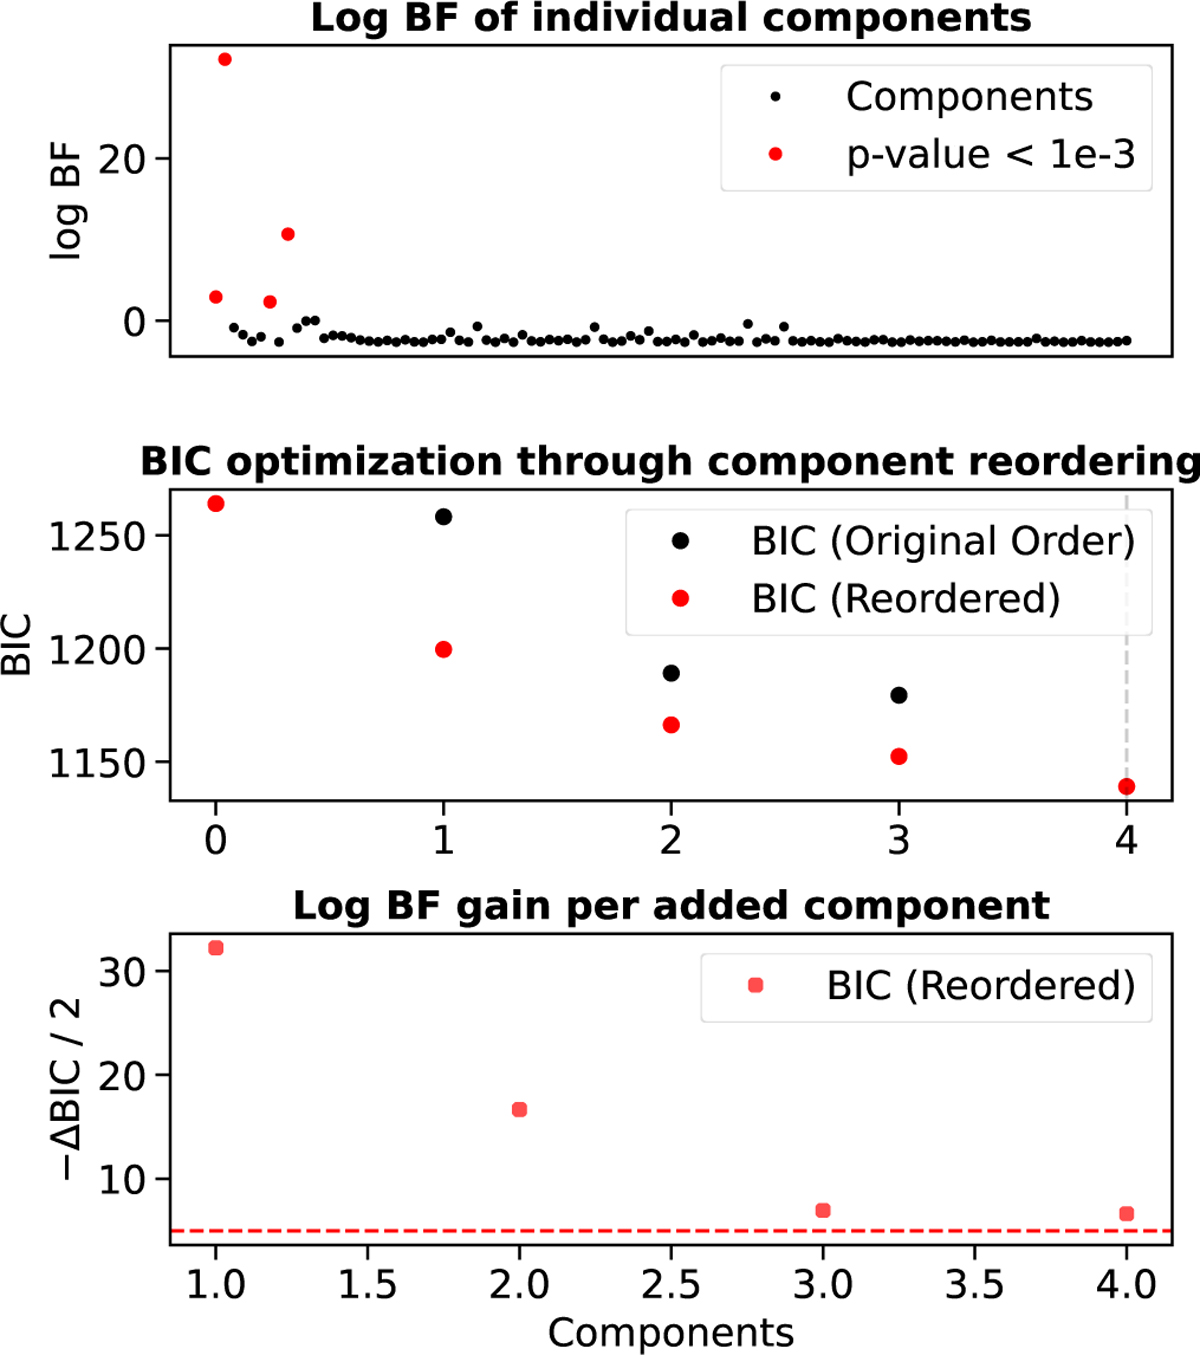
Top: log BF of each individual wPCA component fitted separately to the RV data. Components that pass the permutation test with a p-value below 10−3 are highlighted in red. Middle: BIC values before and after reordering the significant components. Bottom: gain in model evidence associated with each additional component and the red dashed line marks the threshold of 5.
Current usage metrics show cumulative count of Article Views (full-text article views including HTML views, PDF and ePub downloads, according to the available data) and Abstracts Views on Vision4Press platform.
Data correspond to usage on the plateform after 2015. The current usage metrics is available 48-96 hours after online publication and is updated daily on week days.
Initial download of the metrics may take a while.