Open Access
Fig. B.1
Download original image
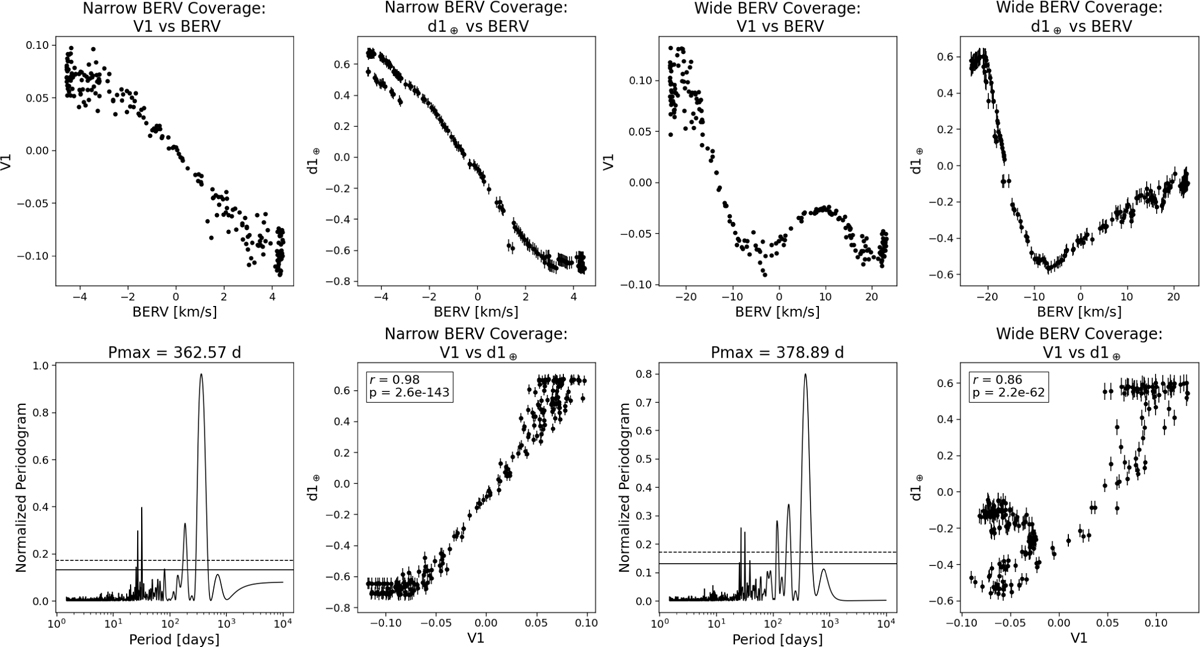
Relationship between the first principal component V1 and the telluric contamination indicator d1⊕ in the simulated data. Top: How V1 and d1⊕ vary with BERV for narrow and wide coverage. Bottom: Periodogram of V1 and the correlation between V1 and d1⊕.
Current usage metrics show cumulative count of Article Views (full-text article views including HTML views, PDF and ePub downloads, according to the available data) and Abstracts Views on Vision4Press platform.
Data correspond to usage on the plateform after 2015. The current usage metrics is available 48-96 hours after online publication and is updated daily on week days.
Initial download of the metrics may take a while.