Fig. 1.
Download original image
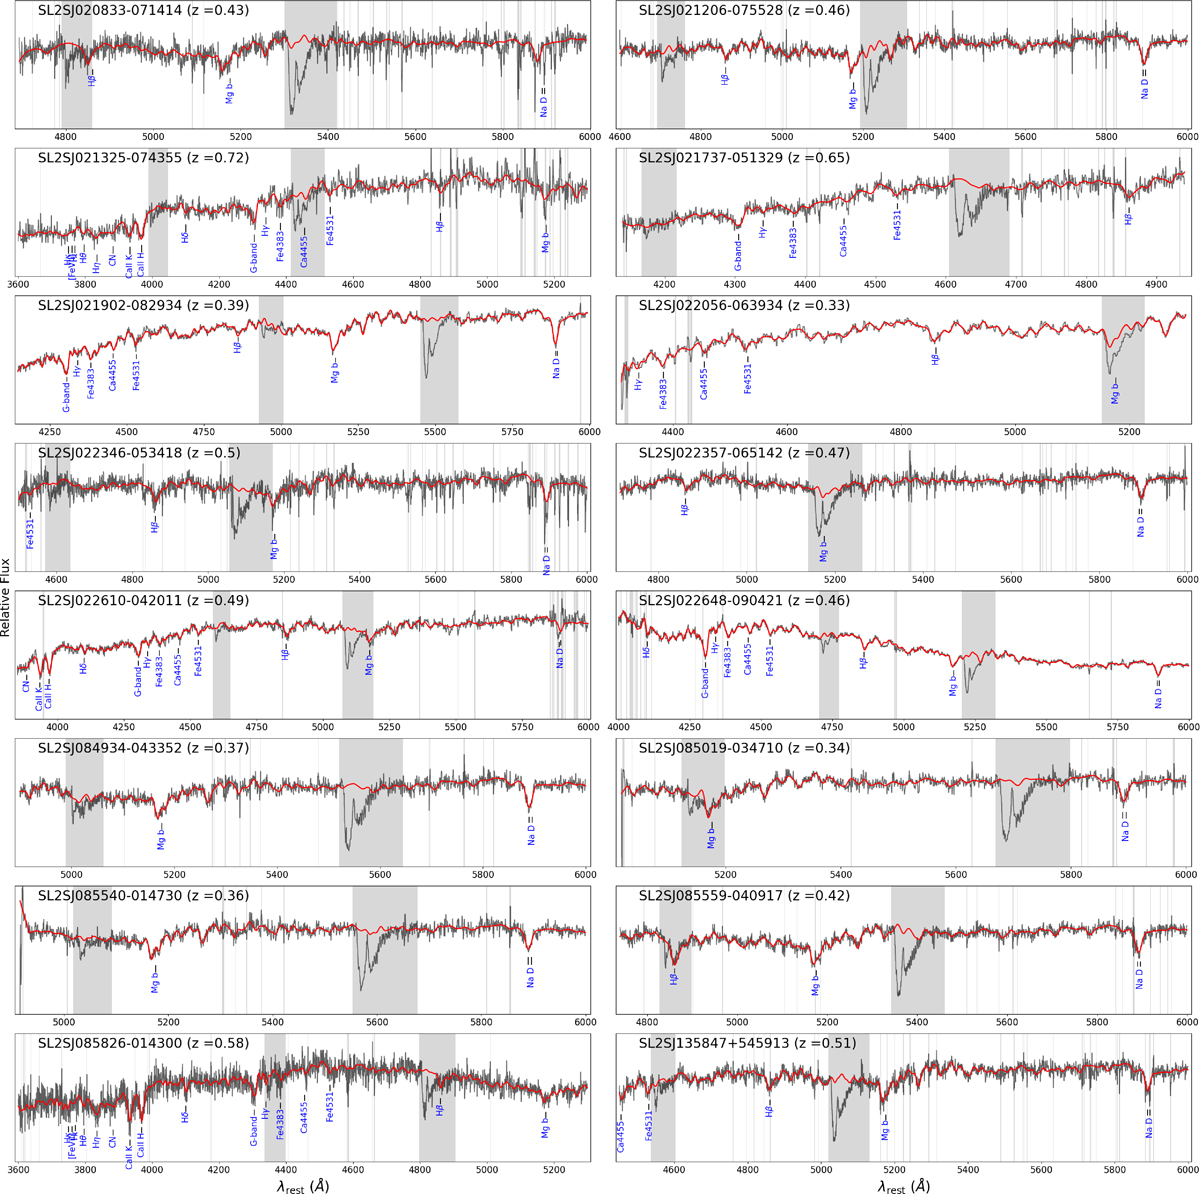
Spectra of the 16 of the 31 lens galaxies that were observed with LRIS on the Keck Telescope. In each panel, the black line shows the observed spectrum, and the red line shows the best-fit model from pPXF. The gray regions mark the wavelength range that we excluded from the fitting and typically these regions correspond to atmospheric absorption lines. Each panel also indicates the name of the system, the lens galaxy redshift, and prominent absorption features in the spectra.
Current usage metrics show cumulative count of Article Views (full-text article views including HTML views, PDF and ePub downloads, according to the available data) and Abstracts Views on Vision4Press platform.
Data correspond to usage on the plateform after 2015. The current usage metrics is available 48-96 hours after online publication and is updated daily on week days.
Initial download of the metrics may take a while.