Fig. 3.
Download original image
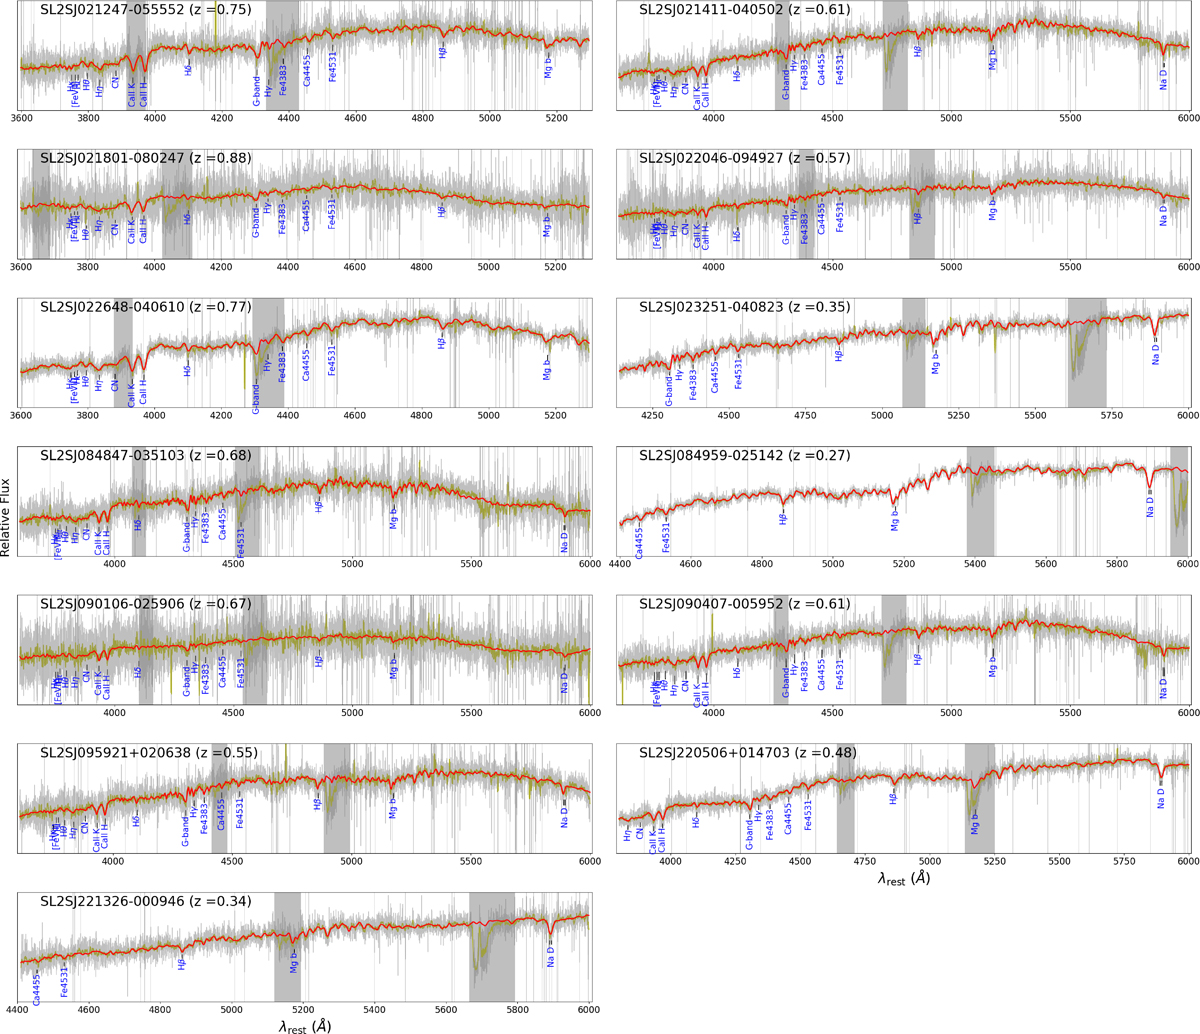
Spectra of 13 lens galaxies observed with the X-shooter spectrograph on the VLT. In each panel, the gray line shows the observed spectrum, and the red line presents the best-fit model from pPXF. We also plot the smoothed version (the yellow line) of the observed spectrum. The gray bands mark the wavelength range we excluded from the fit and typically they correspond to the atmospheric absorption lines. Each panel also indicates the name of the system, the lens galaxy redshift, and prominent absorption features in the spectra.
Current usage metrics show cumulative count of Article Views (full-text article views including HTML views, PDF and ePub downloads, according to the available data) and Abstracts Views on Vision4Press platform.
Data correspond to usage on the plateform after 2015. The current usage metrics is available 48-96 hours after online publication and is updated daily on week days.
Initial download of the metrics may take a while.