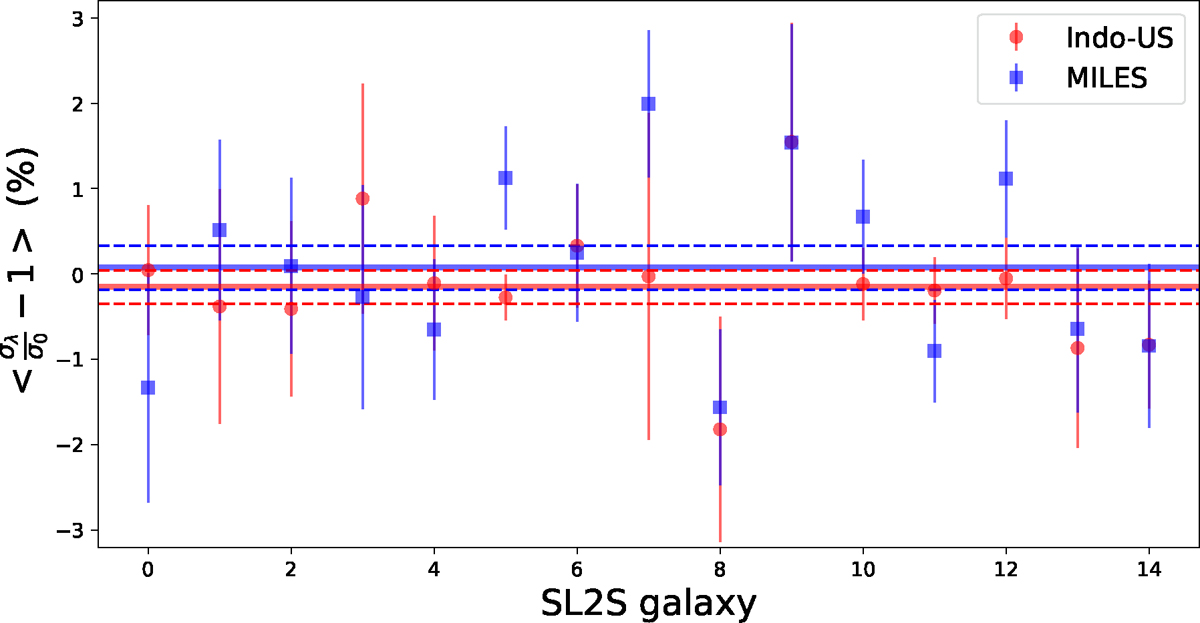
Fig. 6.
Download original image
For each galaxy with high-quality spectra in the sample (S/N > 20/Å), we show the mean and scatter in the value of stellar velocity dispersion when masking one of the main absorption features (CaHK, G-band, MgB, or NaD) with respect to the value obtained for the entire spectrum. The thick horizontal lines represent the sample average, and the dashed lines show the error on the mean.
Current usage metrics show cumulative count of Article Views (full-text article views including HTML views, PDF and ePub downloads, according to the available data) and Abstracts Views on Vision4Press platform.
Data correspond to usage on the plateform after 2015. The current usage metrics is available 48-96 hours after online publication and is updated daily on week days.
Initial download of the metrics may take a while.