Fig. 7.
Download original image
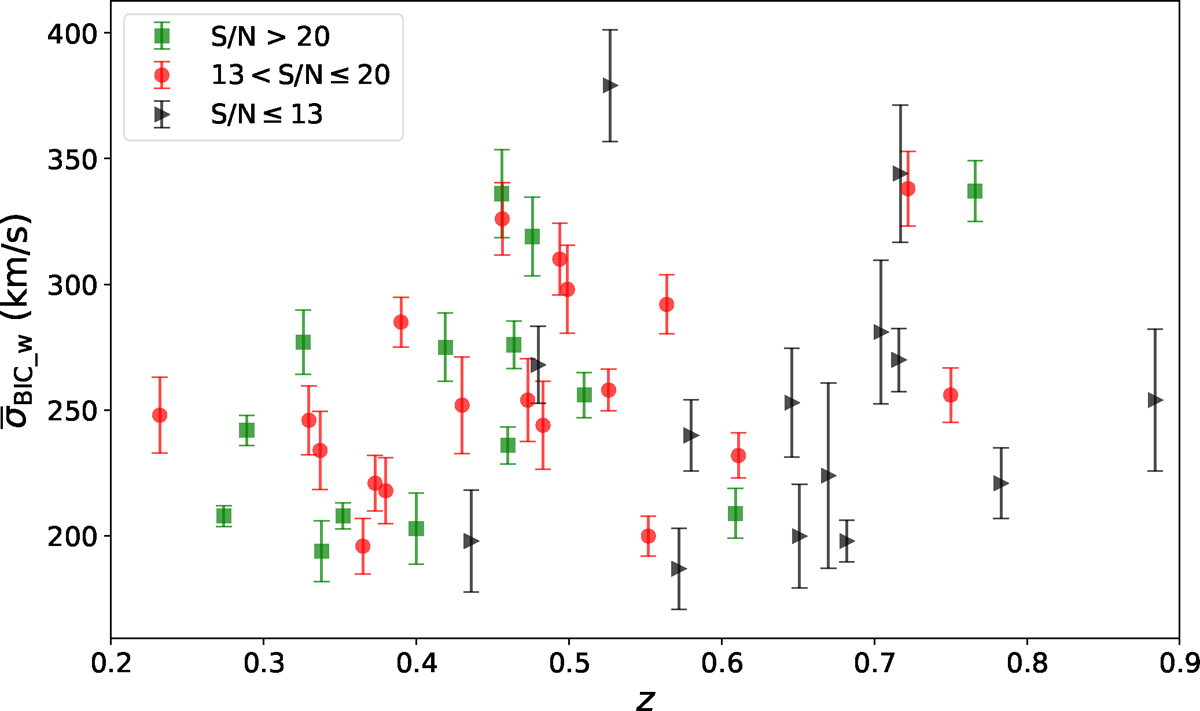
BIC-weighted velocity dispersions of the SL2S sample as a function of redshift. The green, red, and black markers show galaxies in three different S/N bins, S/N > 20, 13 < S/N ≤ 20, and S/N > 20, respectively. The associated error bars show the total uncertainties in the measured velocity dispersions and are dominated by the statistical uncertainties, which are driven by the S/Ns.
Current usage metrics show cumulative count of Article Views (full-text article views including HTML views, PDF and ePub downloads, according to the available data) and Abstracts Views on Vision4Press platform.
Data correspond to usage on the plateform after 2015. The current usage metrics is available 48-96 hours after online publication and is updated daily on week days.
Initial download of the metrics may take a while.