Open Access
Fig. 9.
Download original image
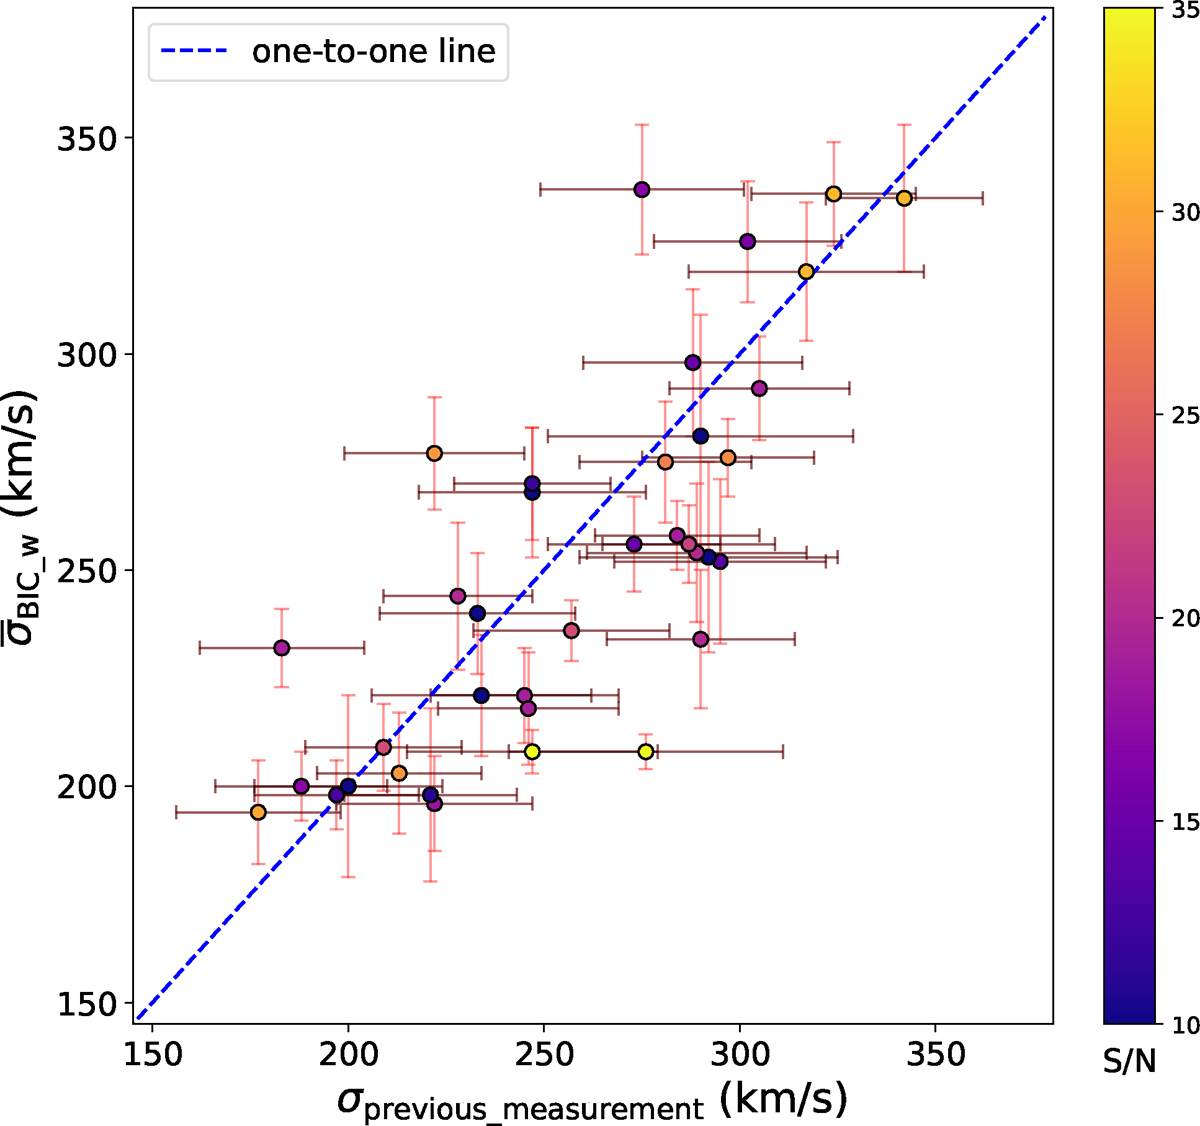
Comparison of the velocity dispersions for 37 galaxies as measured in this paper (y-axis) and by Sonnenfeld et al. (2013a, x-axis) based on the same spectra. The galaxies are color-coded by the S/N measured in this work. The method alone changed, i.e., chiefly improvements in the stellar template libraries.
Current usage metrics show cumulative count of Article Views (full-text article views including HTML views, PDF and ePub downloads, according to the available data) and Abstracts Views on Vision4Press platform.
Data correspond to usage on the plateform after 2015. The current usage metrics is available 48-96 hours after online publication and is updated daily on week days.
Initial download of the metrics may take a while.