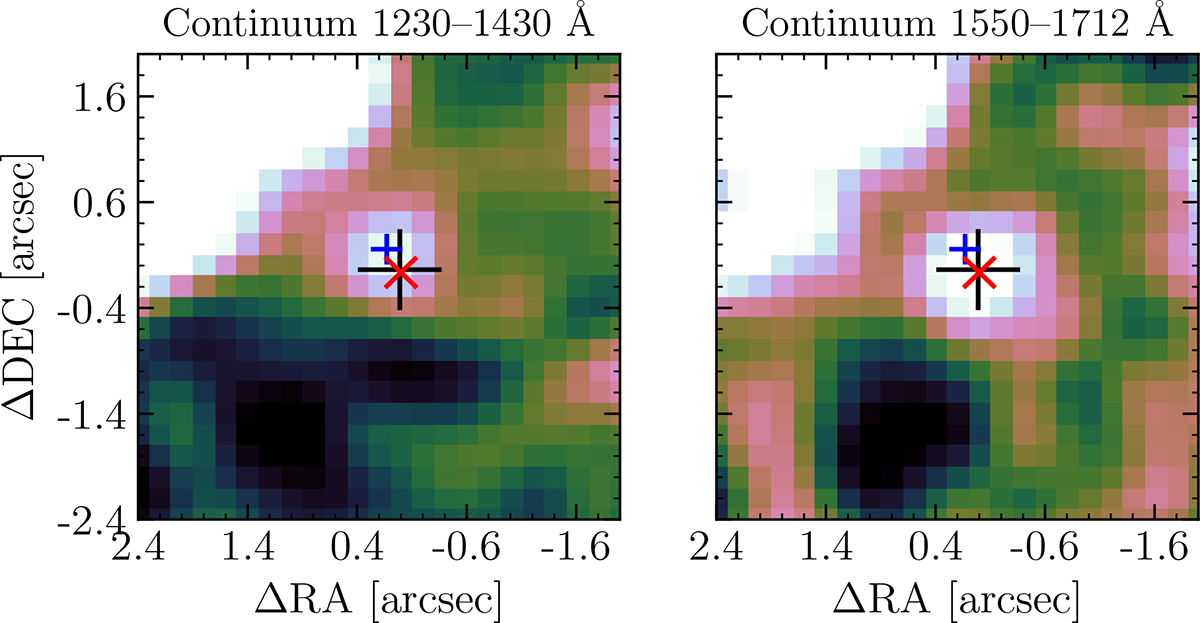
Fig. B.1.
Download original image
MUSE images of the continuum bands probing 1230–1430 Å (cont. blue) and 1550–1712 Å (cont. red). The centroid of the emission shows a clear shift of ≈0.2″. The centroids of these two components are shown in Fig. 9 in comparison with the positions of other spatially resolved spectral features. The bright source in the northeast corner is the blend of two low-z interlopers, clearly visible in Fig. 6. The black cross marks the NIRCam coordinates of A2744-45924. The blue and red crosses indicate the flux-weighted centroids of the blue and red continuum components, respectively.
Current usage metrics show cumulative count of Article Views (full-text article views including HTML views, PDF and ePub downloads, according to the available data) and Abstracts Views on Vision4Press platform.
Data correspond to usage on the plateform after 2015. The current usage metrics is available 48-96 hours after online publication and is updated daily on week days.
Initial download of the metrics may take a while.