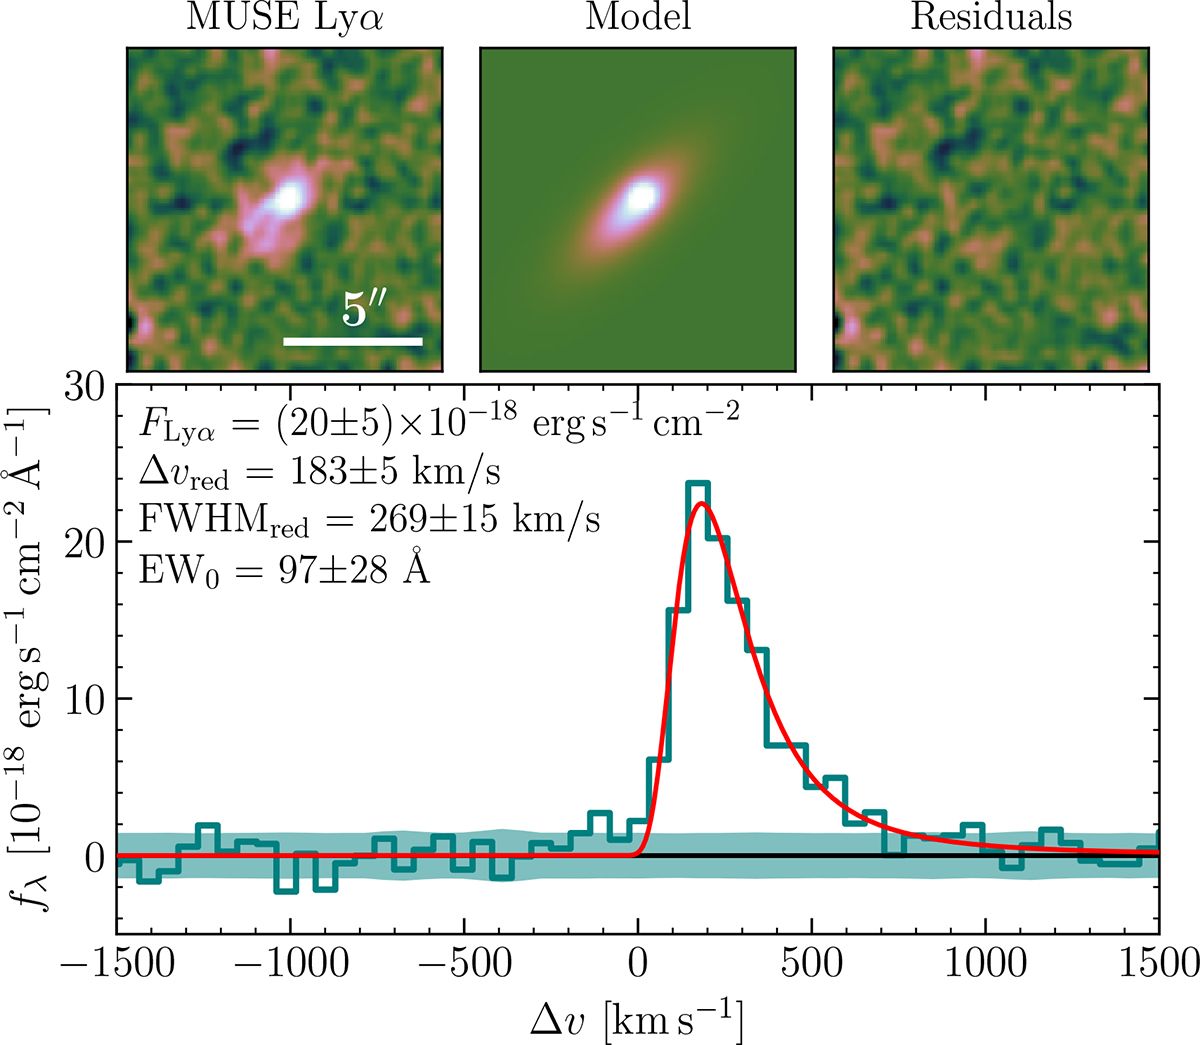
Fig. 3.
Download original image
Lyα spatial morphology and 1D spectrum. Top: MUSE pseudo-narrowband of the Lyα emission (left), core+halo model (center), and residuals of the fit (right). The morphology of the Lyα halo is fitted to a two-component model composed of a 2D Gaussian and exponential. The scale length of the exponential component (halo) is h = 5.7 ± 0.7 pkpc, correcting for magnification. Bottom: optimally extracted 1D spectrum of Lyα. We show the fitted skewed Gaussian model (red line). The Lyα line shows a narrow single-peaked profile, typical of star-forming galaxies. The bottom axis shows velocities with respect to the systemic redshift of the Hα emission.
Current usage metrics show cumulative count of Article Views (full-text article views including HTML views, PDF and ePub downloads, according to the available data) and Abstracts Views on Vision4Press platform.
Data correspond to usage on the plateform after 2015. The current usage metrics is available 48-96 hours after online publication and is updated daily on week days.
Initial download of the metrics may take a while.