Fig. 10
Download original image
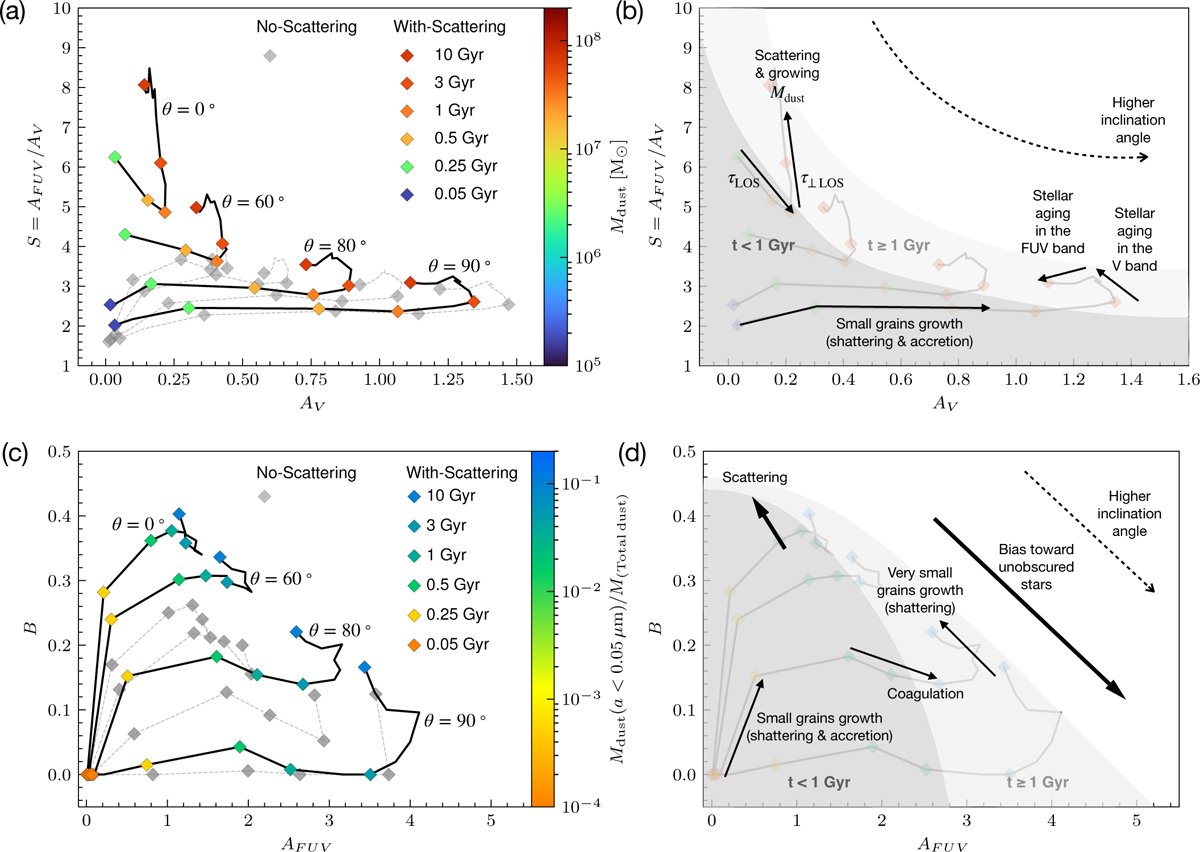
(a) Relation between the slope and AV. Colored diamonds represent the dynamic-with-scattering model, while gray diamonds shows the dynamic-no-scattering model. The color indicates the total dust mass within the galaxy for the dynamic dust model, which depends on simulation time as indicated by the legend. Here, the diamonds correspond to simulation snapshots at t = 0.05, 0.25, 0.5, 1, 3, and 10 Gyr. For the dynamic-with-scattering and no-scattering models, solid and dashed lines connect the diamonds, respectively, representing the evolutionary tracks at each inclination angle. (b) Physical explanation of the relation between the slope and AV. Solid arrows indicate the effects shaping the evolution of the attenuation curve slope, while the dashed arrow highlights the dependence of the slope on the inclination angle. The dark gray-shaded region corresponds to the early phase of our MW-like galaxy (t < 1 Gyr), whereas the light gray-shaded region marks the later phase (t ≥ 1 Gyr). (c) Relation between the 2175 Å bump strength and AFUV. The color indicates the mass fraction of small grains (a < 0.05 µm) relative to the total dust mass within the galaxy for the dynamic dust model, which depends on simulation time as indicated by the legend. Here, the diamonds correspond to simulation snapshots at t = 0.05, 0.25, 0.5, 1, 3, and 10 Gyr. (d) Physical explanation of the relation between the 2175 Å bump strength and AFUV. Thin solid arrows indicate the effects shaping the evolution of the 2175 Å bump, while thick solid arrows represent effects that systematically change the trend across inclination angles or AFUV. The dashed arrow highlights the dependence of the slope on the inclination angle.
Current usage metrics show cumulative count of Article Views (full-text article views including HTML views, PDF and ePub downloads, according to the available data) and Abstracts Views on Vision4Press platform.
Data correspond to usage on the plateform after 2015. The current usage metrics is available 48-96 hours after online publication and is updated daily on week days.
Initial download of the metrics may take a while.