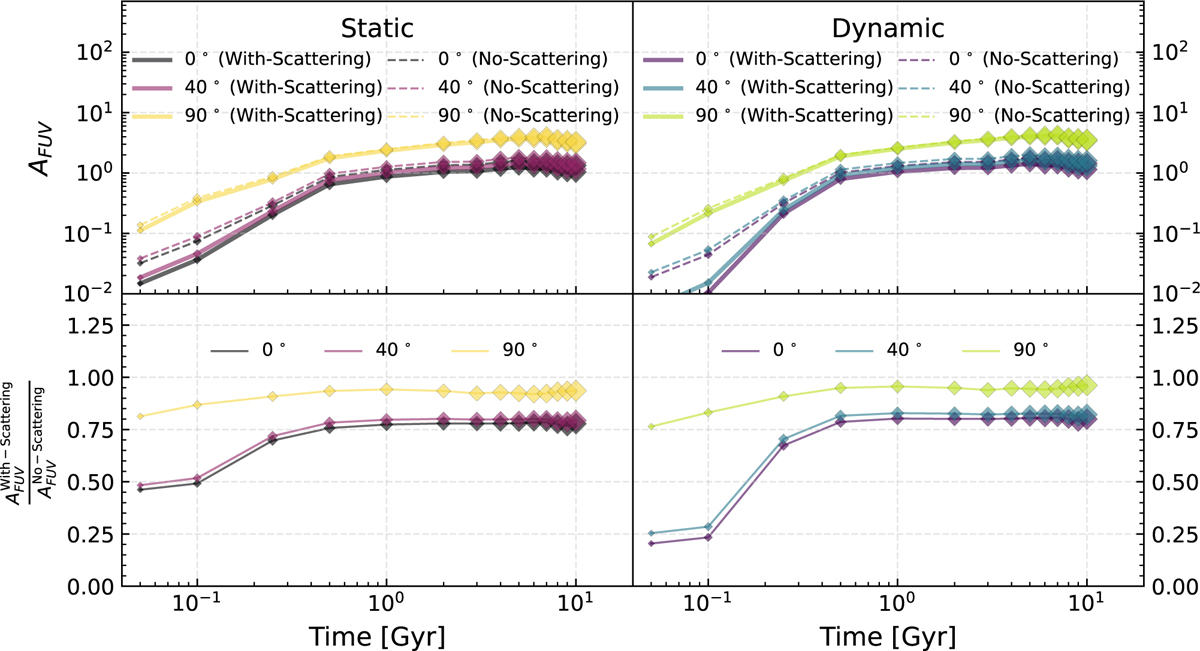
Fig. C.1
Download original image
Time evolution of the global AV for the static and dynamic dust models in our Milky Way-like galaxy simulation is shown in the left and right panels, respectively. In each panel, solid lines indicate attenuation including scattering (with-scattering), while dashed lines represent attenuation neglecting scattering (no-scattering). The inclination angle is color-coded. The bottom panels show the ratio between the with-scattering and no-scattering attenuation. This ratio quantifies the impact of scattering on the total attenuation, with lower values indicating a stronger contribution from scattering.
Current usage metrics show cumulative count of Article Views (full-text article views including HTML views, PDF and ePub downloads, according to the available data) and Abstracts Views on Vision4Press platform.
Data correspond to usage on the plateform after 2015. The current usage metrics is available 48-96 hours after online publication and is updated daily on week days.
Initial download of the metrics may take a while.