Open Access
Fig. D.1
Download original image
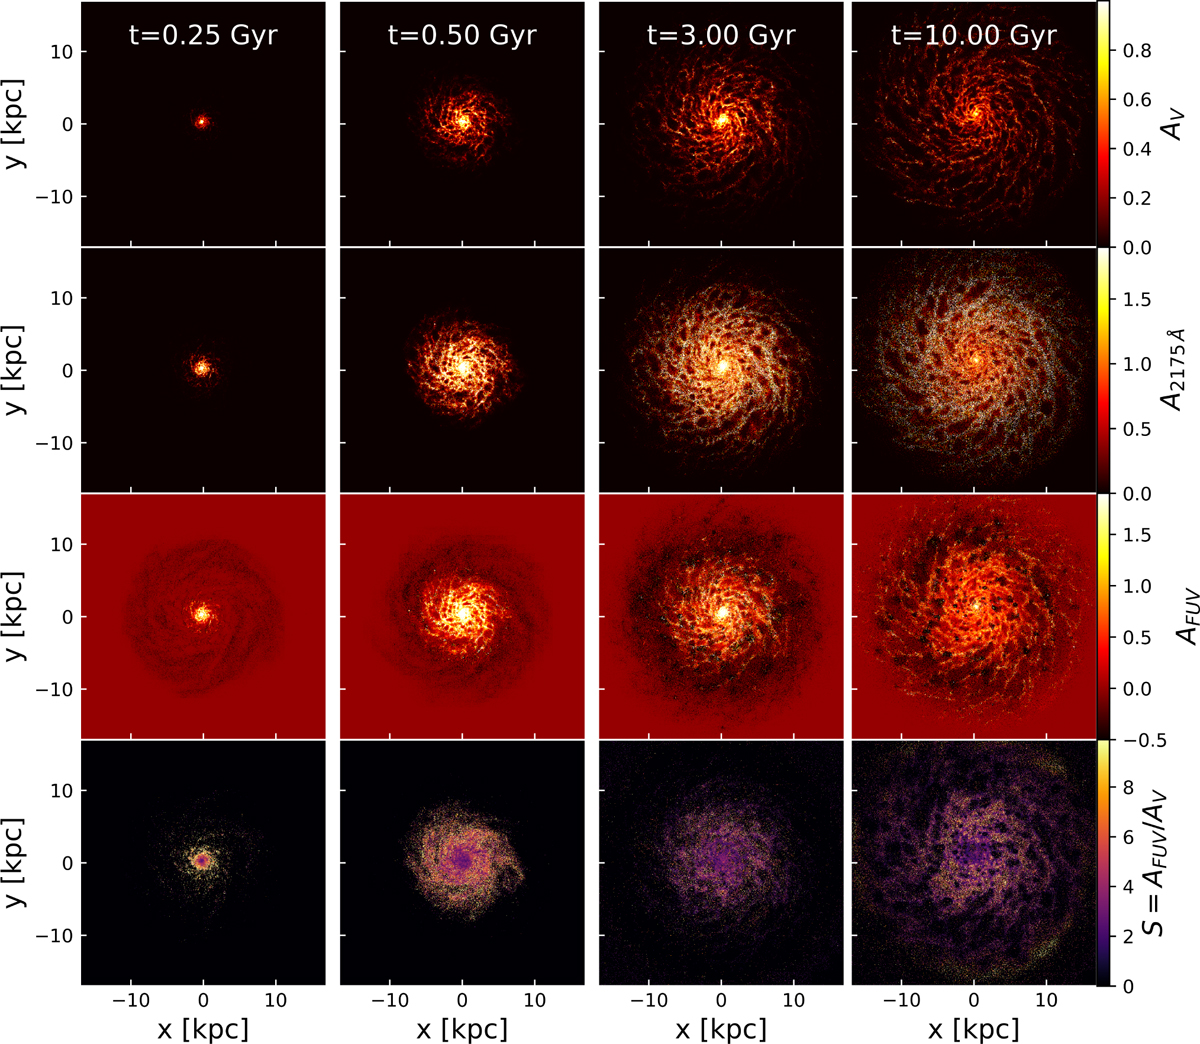
Time evolution of attenuation maps at V-band, 2175 Å, and FUV-band wavelengths as well as the map of slope (top to bottom panels). The time evolution is exhibited from the left to right panels.
Current usage metrics show cumulative count of Article Views (full-text article views including HTML views, PDF and ePub downloads, according to the available data) and Abstracts Views on Vision4Press platform.
Data correspond to usage on the plateform after 2015. The current usage metrics is available 48-96 hours after online publication and is updated daily on week days.
Initial download of the metrics may take a while.