Fig. 3
Download original image
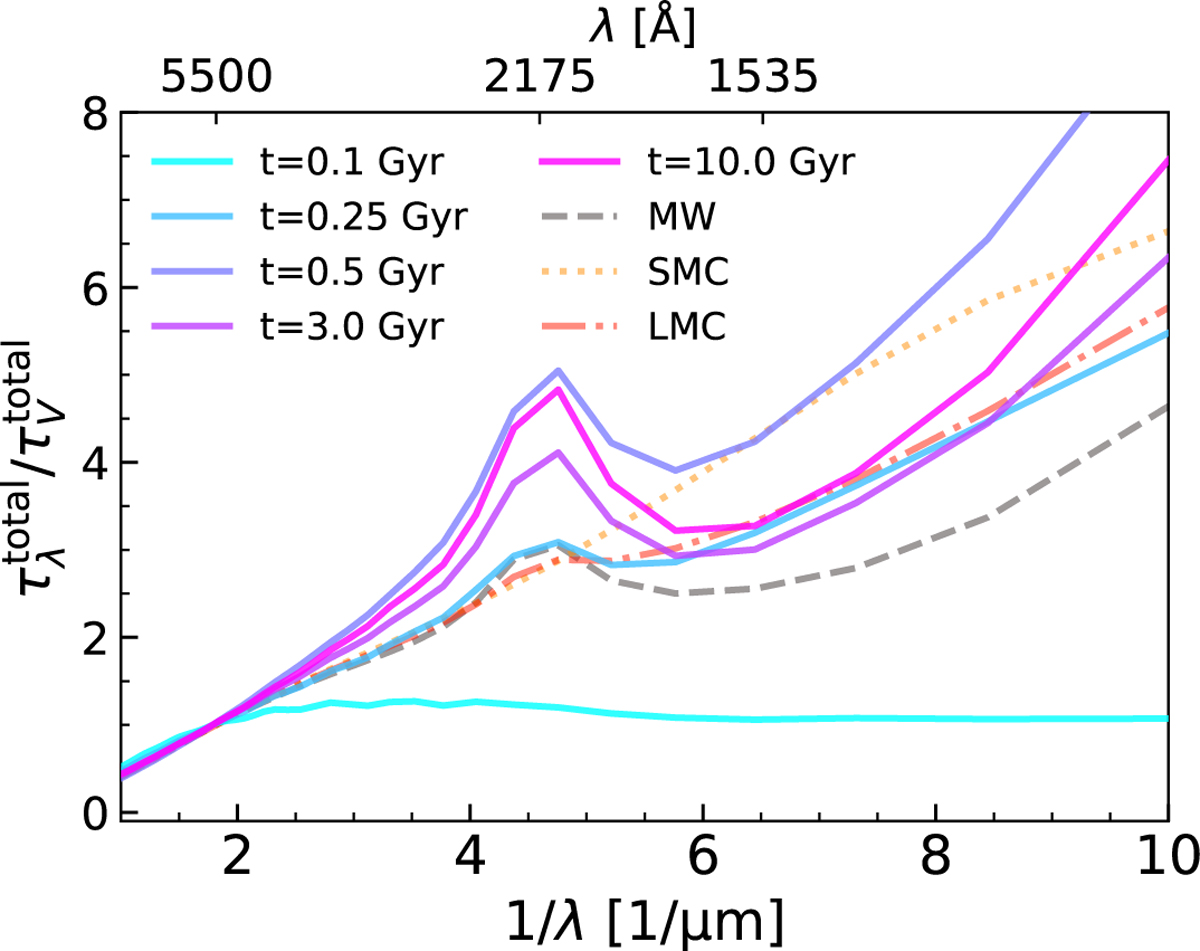
Time evolution of the average extinction curve of the MW-like galaxy simulation indicated by colored solid lines. The extinction curve is estimated by Eq. (2) and normalized by the opacity at the V-band wavelength (λ = 5500 Å). The dashed gray, dotted orange, and dash-dotted red lines represent the extinction curves of the MW, SMC, and LMC, respectively (Pei 1992; Li et al. 2008).
Current usage metrics show cumulative count of Article Views (full-text article views including HTML views, PDF and ePub downloads, according to the available data) and Abstracts Views on Vision4Press platform.
Data correspond to usage on the plateform after 2015. The current usage metrics is available 48-96 hours after online publication and is updated daily on week days.
Initial download of the metrics may take a while.