Fig. 4
Download original image
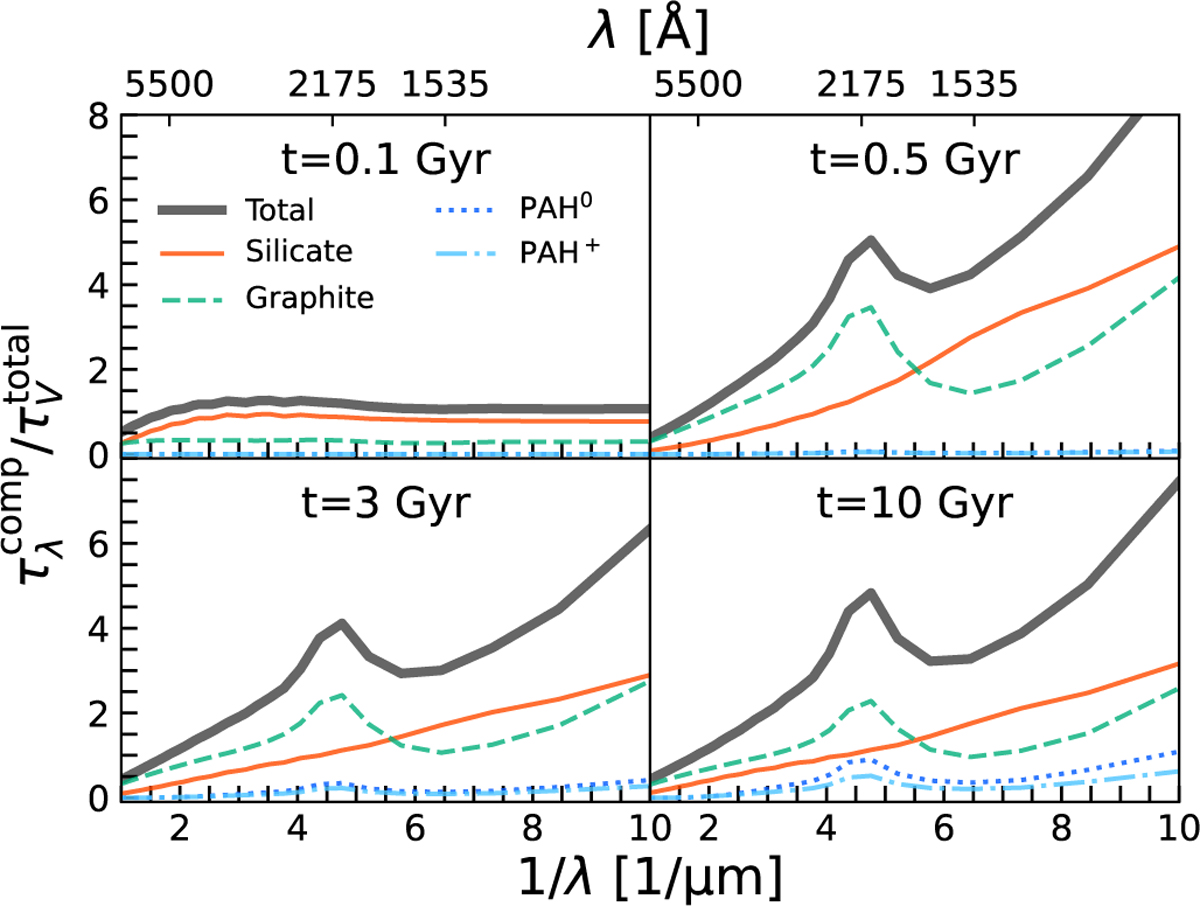
Contribution of each dust component to the average extinction curve of the MW-like galaxy simulation at various times (t = 0.1, 0.5, 3.0, and 10.0 Gyr). The black thick line is the total average extinction curve, while the orange solid, green dashed, blue dotted, and light blue dash-dotted thin lines represent the contributions of silicate, graphite, PAH0, and PAH+, respectively. At t = 0.1 Gyr, the extinction curve is dominated by silicate grains across all wavelengths. However, at later times, carbonaceous grains become the dominant contributors to extinction at wavelengths longer than 2000 Å.
Current usage metrics show cumulative count of Article Views (full-text article views including HTML views, PDF and ePub downloads, according to the available data) and Abstracts Views on Vision4Press platform.
Data correspond to usage on the plateform after 2015. The current usage metrics is available 48-96 hours after online publication and is updated daily on week days.
Initial download of the metrics may take a while.