Fig. 6
Download original image
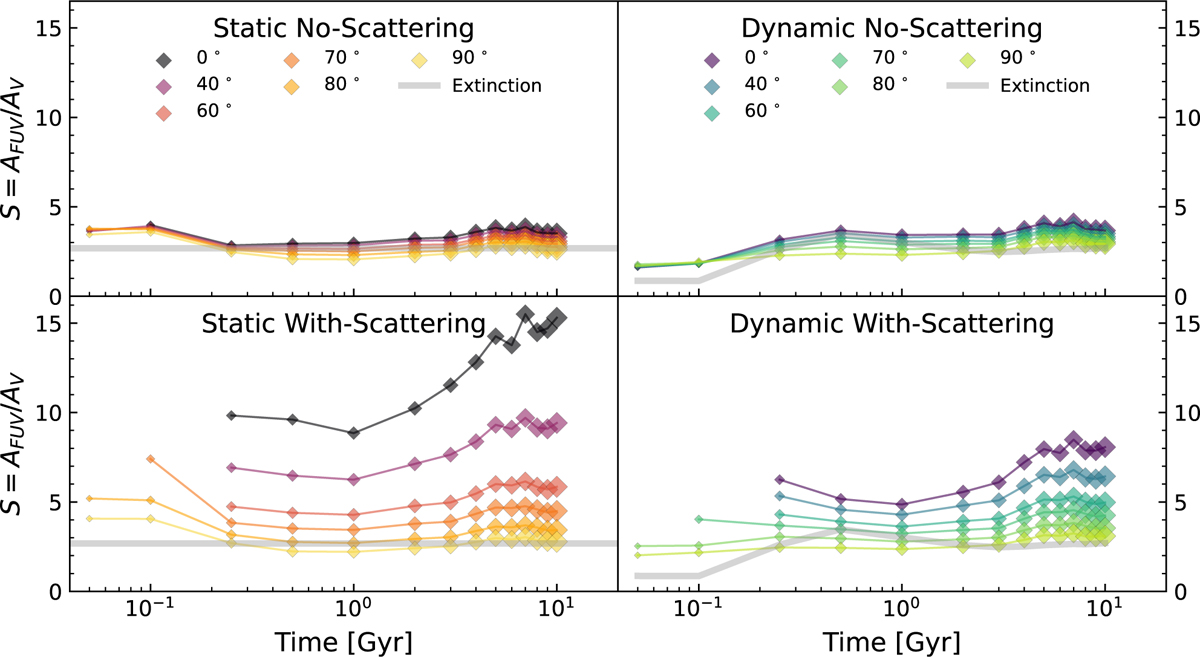
Time evolution of the slope for the global attenuation curves from the four different models (dynamic, dynamic-no-scattering, static, and static-no-scattering) of the MW-like galaxy simulation. The inclination angle is color-coded in each panel. Here, all models with Av < 0.01 are excluded. The gray thick lines represent the time evolution of the slope of the average extinction curves for the static and dynamic dust models in the left and right panels, respectively. The value of slope for the static dust model corresponds that of the MW (Pei 1992; Li et al. 2008).
Current usage metrics show cumulative count of Article Views (full-text article views including HTML views, PDF and ePub downloads, according to the available data) and Abstracts Views on Vision4Press platform.
Data correspond to usage on the plateform after 2015. The current usage metrics is available 48-96 hours after online publication and is updated daily on week days.
Initial download of the metrics may take a while.