Fig. 8
Download original image
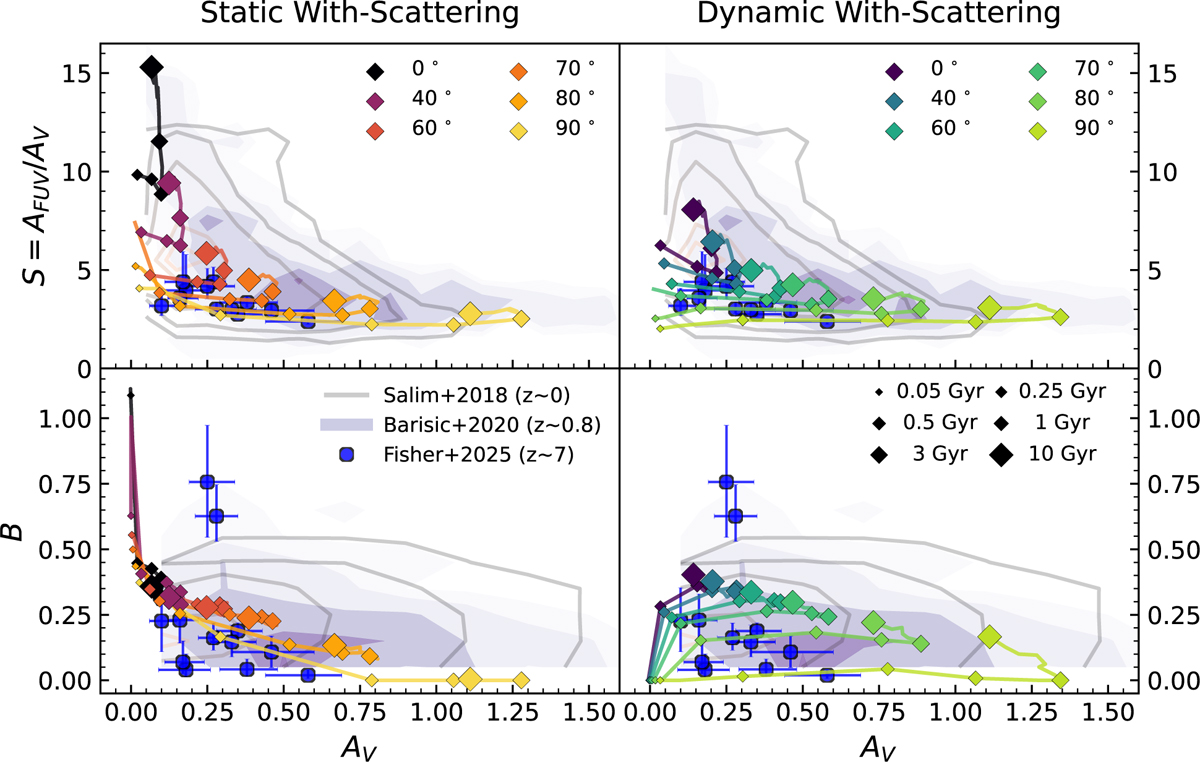
Upper panels: relationships between the slope and AV for the static-with-scattering and dynamic-with-scattering models (left and right, respectively) at different inclination angles. Diamonds indicate simulation snapshots at t = 0.05, 0.25, 0.5, 1, 3, and 10 Gyr, with sizes increasing with time. Solid lines connect diamonds at each inclination angle, representing evolutionary tracks. Gray and purple contours illustrate 25th, 50th, 75th, 95th, and 99th percentiles for the galaxies from the GSWLC observational catalog (Salim et al. 2018) and the Large Early Galaxy Astrophysics Census survey (Barišić et al. 2020), respectively. The blue symbols indicates the observational measurements made for high-redshift galaxies from the REBELS ALMA large program (Fisher et al. 2025). Lower panels: relationships between the bump and AV for static-with-scattering and dynamic-with-scattering models (left and right panels, respectively).
Current usage metrics show cumulative count of Article Views (full-text article views including HTML views, PDF and ePub downloads, according to the available data) and Abstracts Views on Vision4Press platform.
Data correspond to usage on the plateform after 2015. The current usage metrics is available 48-96 hours after online publication and is updated daily on week days.
Initial download of the metrics may take a while.