Fig. 4.
Download original image
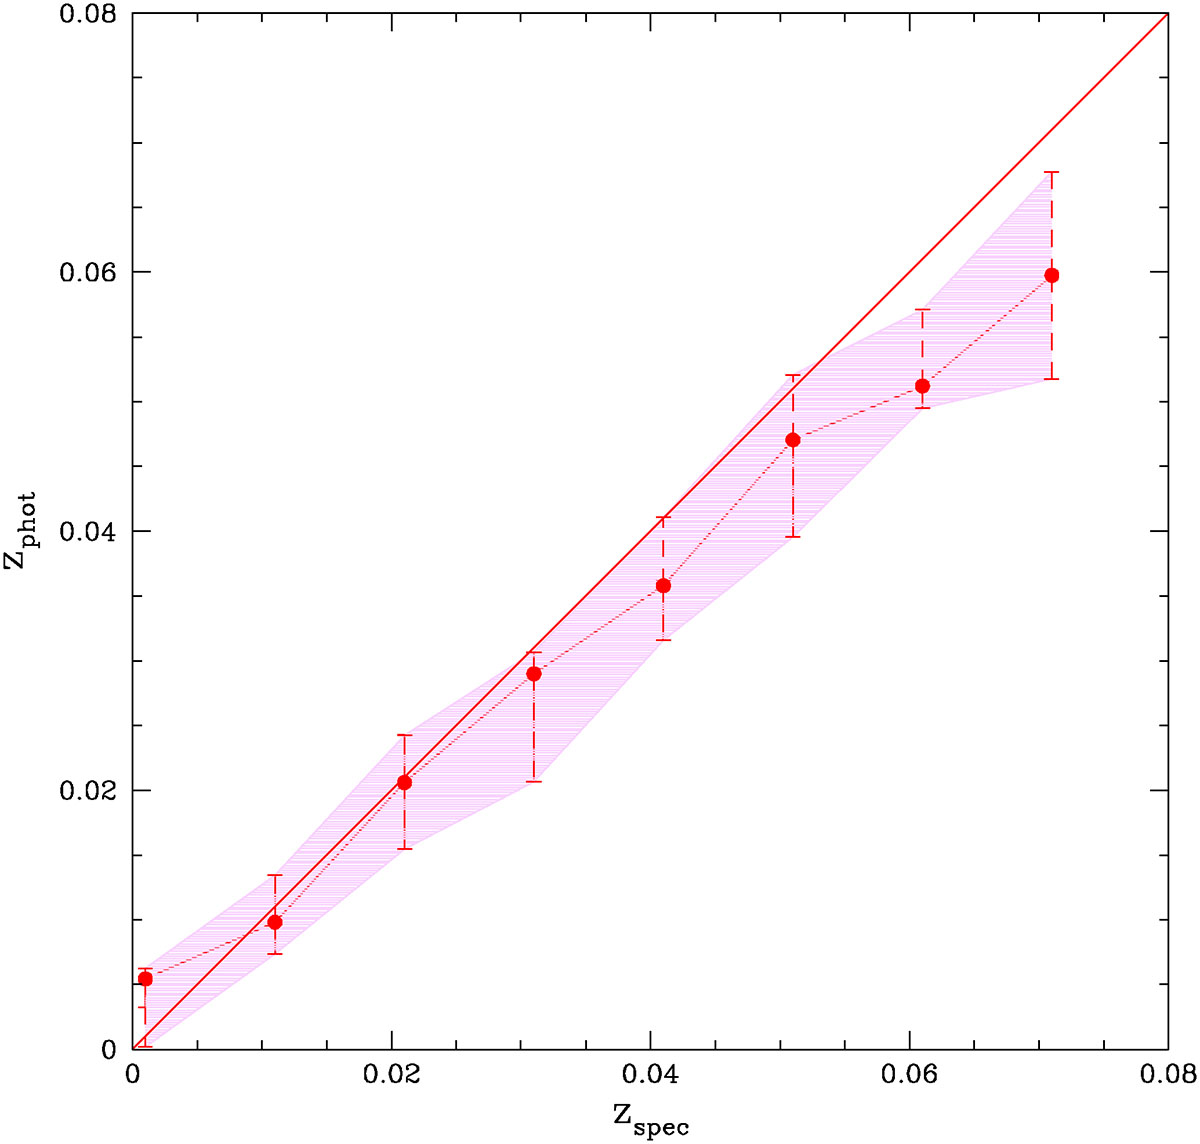
Calibration results for the ANNz code. The solid line indicates the one-to-one relation between spectroscopic and photometric redshifts. The red points represent the mean photometric redshift within each spectroscopic redshift bin, with error bars indicating the standard deviation. The pink shaded region shows the calculated uncertainties in the distribution.
Current usage metrics show cumulative count of Article Views (full-text article views including HTML views, PDF and ePub downloads, according to the available data) and Abstracts Views on Vision4Press platform.
Data correspond to usage on the plateform after 2015. The current usage metrics is available 48-96 hours after online publication and is updated daily on week days.
Initial download of the metrics may take a while.