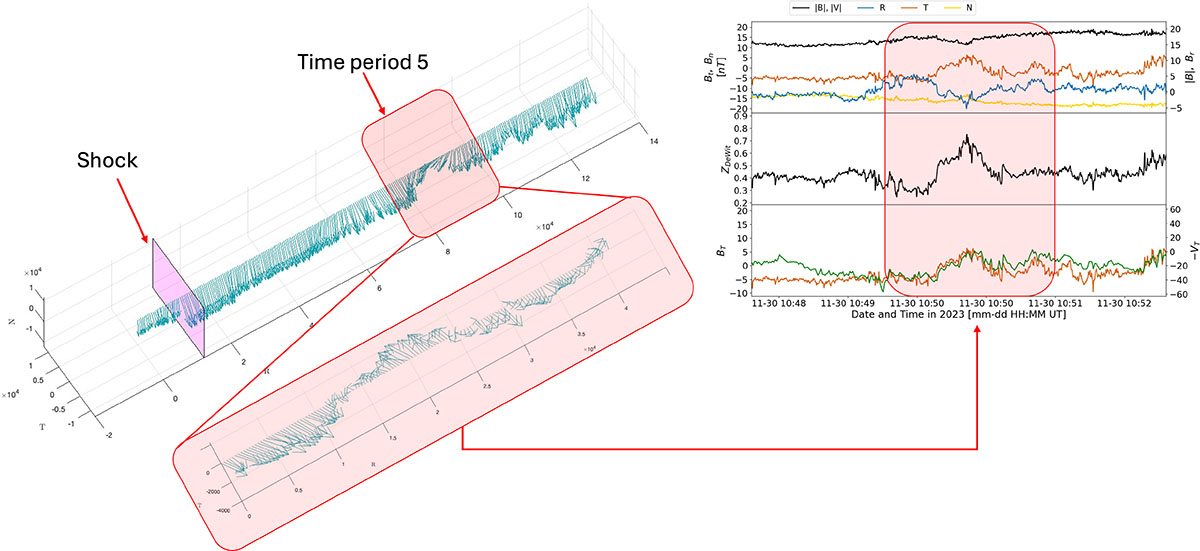
Fig. 12.
Download original image
Left: 3D plot of IMF vector in RTN coordinates immediately downstream of shock #2 (magenta plane), where time period (5) is highlighted (red shaded area). Right: In situ analysis targeting time period (5), where we display, from top to bottom, the magnetic-field magnitude and its components, the Z parameter, and the B–V correlation for the tangential components of magnetic-field and ion velocity, indicating a fluctuation with a high degree of Alfvènicity and a cross helicity close to −1.
Current usage metrics show cumulative count of Article Views (full-text article views including HTML views, PDF and ePub downloads, according to the available data) and Abstracts Views on Vision4Press platform.
Data correspond to usage on the plateform after 2015. The current usage metrics is available 48-96 hours after online publication and is updated daily on week days.
Initial download of the metrics may take a while.