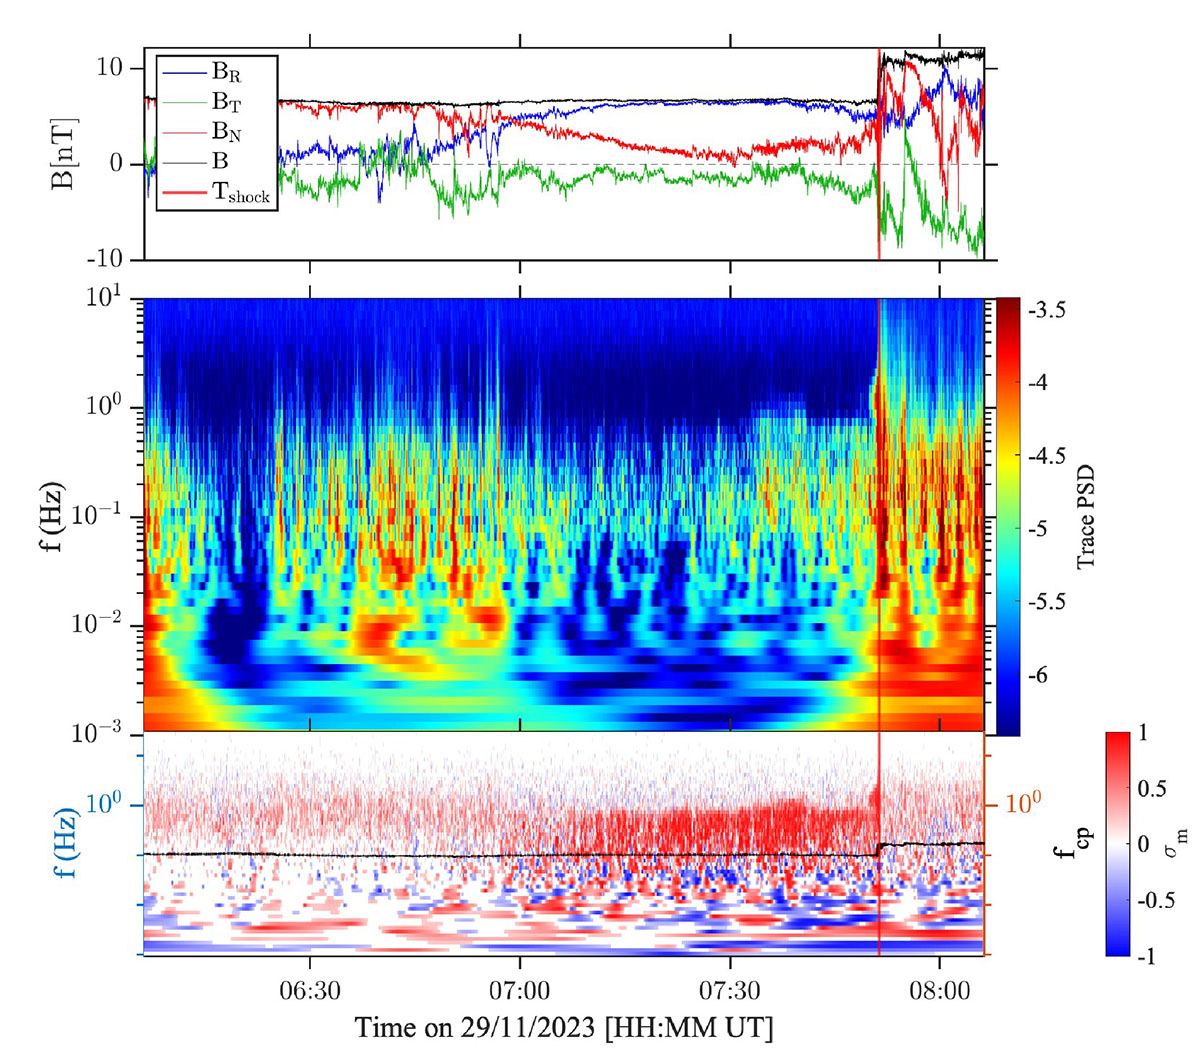
Fig. 2.
Download original image
Analysis of first shock shows very smooth IMF rotation just ahead of the shock (first panel). Trace wavelet spectrogram of the IMF (2nd panel) showing no significant enhancement upstream of the shock transition. The normalised magnetic helicity is shown in the bottom panel (red-blue color map), with the proton plasma frequency overplotted as a black line.
Current usage metrics show cumulative count of Article Views (full-text article views including HTML views, PDF and ePub downloads, according to the available data) and Abstracts Views on Vision4Press platform.
Data correspond to usage on the plateform after 2015. The current usage metrics is available 48-96 hours after online publication and is updated daily on week days.
Initial download of the metrics may take a while.