Fig. 4.
Download original image
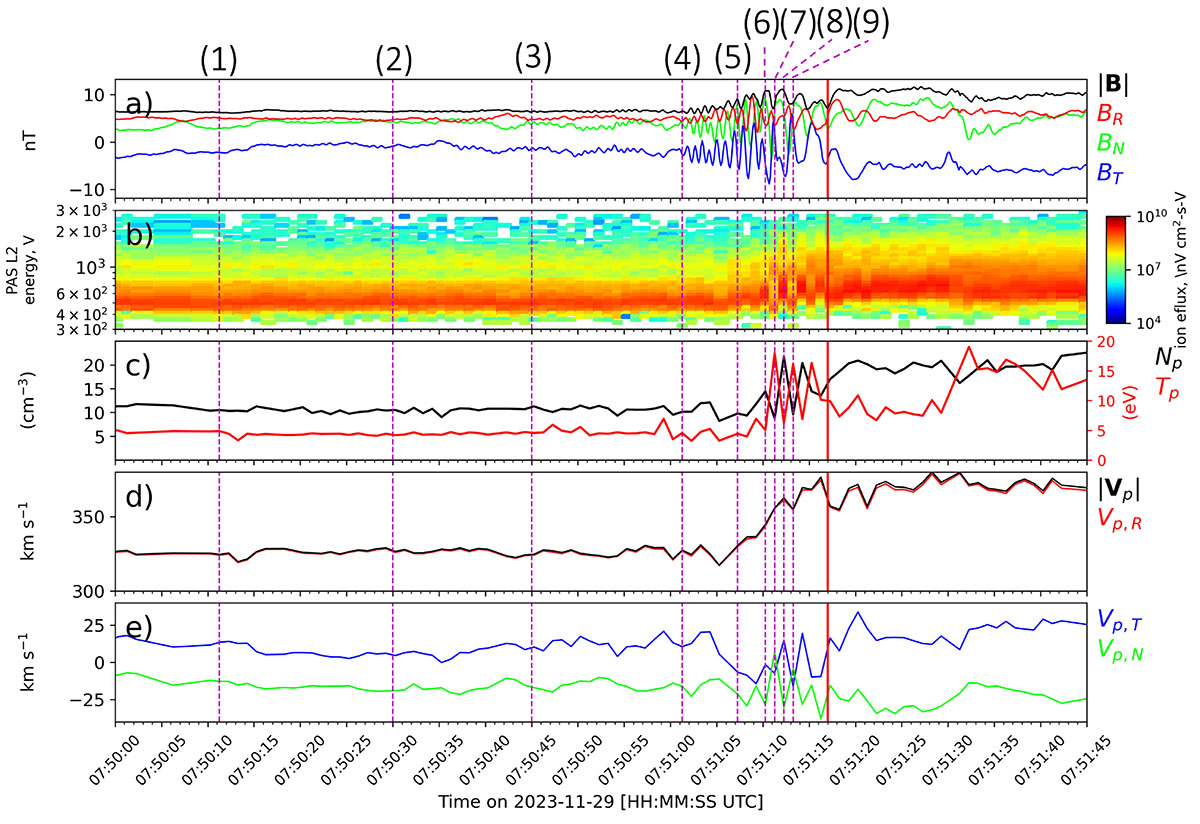
Solar-wind properties in vicinity of shock #1 (indicated by the vertical red line). Panel a) shows |B| in black, and its RTN components in red, blue, and green. Panel b) shows the Proton-Alpha Sensor (PAS) energy-per-charge spectrum (assuming a charge of one) and shows that the proton-velocity distribution is well captured in energy space. The more abundant protons are visible via the horizontal red line; alpha particles are seen via the yellow line around 103 “V” before the shock. Panel c) shows proton density (temperature) in black (red). Panel d) shows radial proton velocity in red and total proton speed in black. Panel e) shows the T (blue) and N (green) components of the proton velocity. Vertical dashed lines indicate the times (1) to (9) at which the reduced velocity-distribution functions are shown in Fig. 5.
Current usage metrics show cumulative count of Article Views (full-text article views including HTML views, PDF and ePub downloads, according to the available data) and Abstracts Views on Vision4Press platform.
Data correspond to usage on the plateform after 2015. The current usage metrics is available 48-96 hours after online publication and is updated daily on week days.
Initial download of the metrics may take a while.