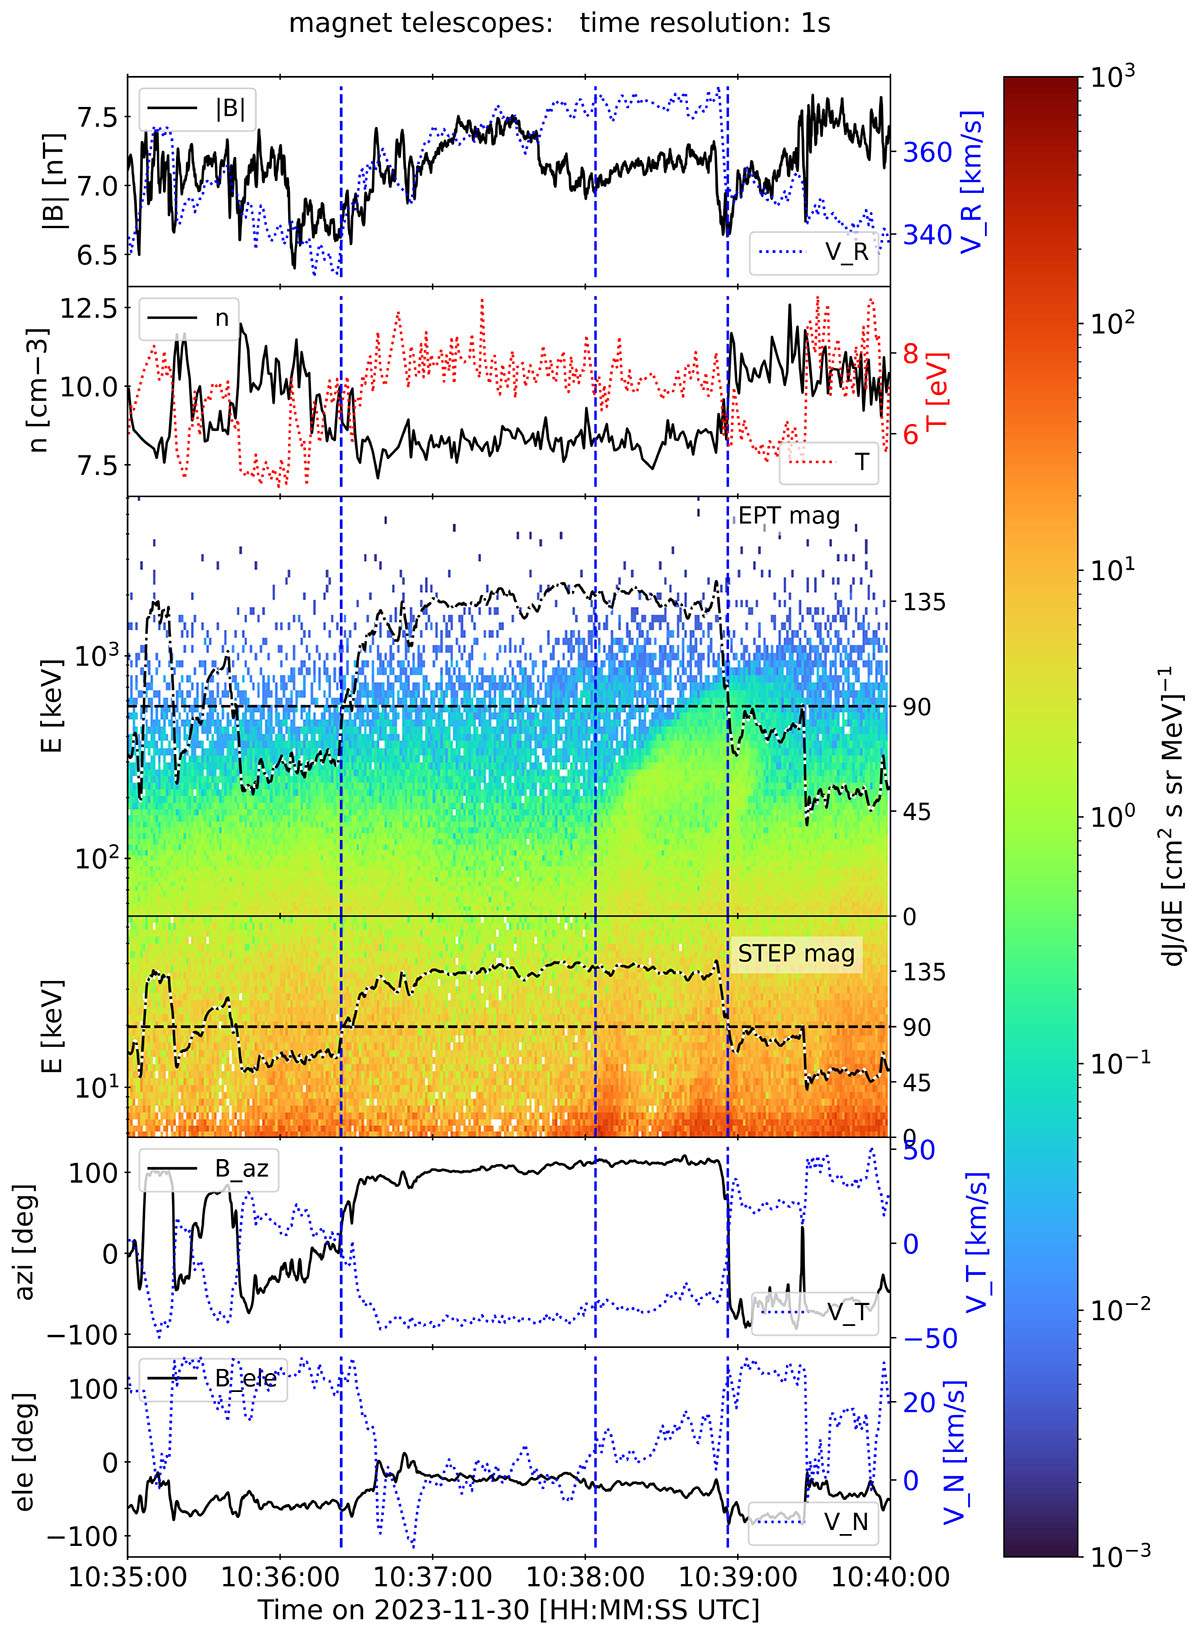
Fig. 8.
Download original image
Time period (1) with its unstable distribution function can be seen between 10:38:00 and 10:39:00. The figure follows the usual structure, but does not show all directions. It shows the sunward EPT and STEP directions. Vertical dashed blue lines indicate the three magnetic discontinuities discussed in the text. The “loop” is visible between 10:38 and just beyond 10:39 between the two blue lines. Measurements of this time period with the STEP sensor are shown in Fig. B.1 and clearly indicate that this time period was very anisotropic, even within the narrow STEP FoV.
Current usage metrics show cumulative count of Article Views (full-text article views including HTML views, PDF and ePub downloads, according to the available data) and Abstracts Views on Vision4Press platform.
Data correspond to usage on the plateform after 2015. The current usage metrics is available 48-96 hours after online publication and is updated daily on week days.
Initial download of the metrics may take a while.