Fig. 1
Download original image
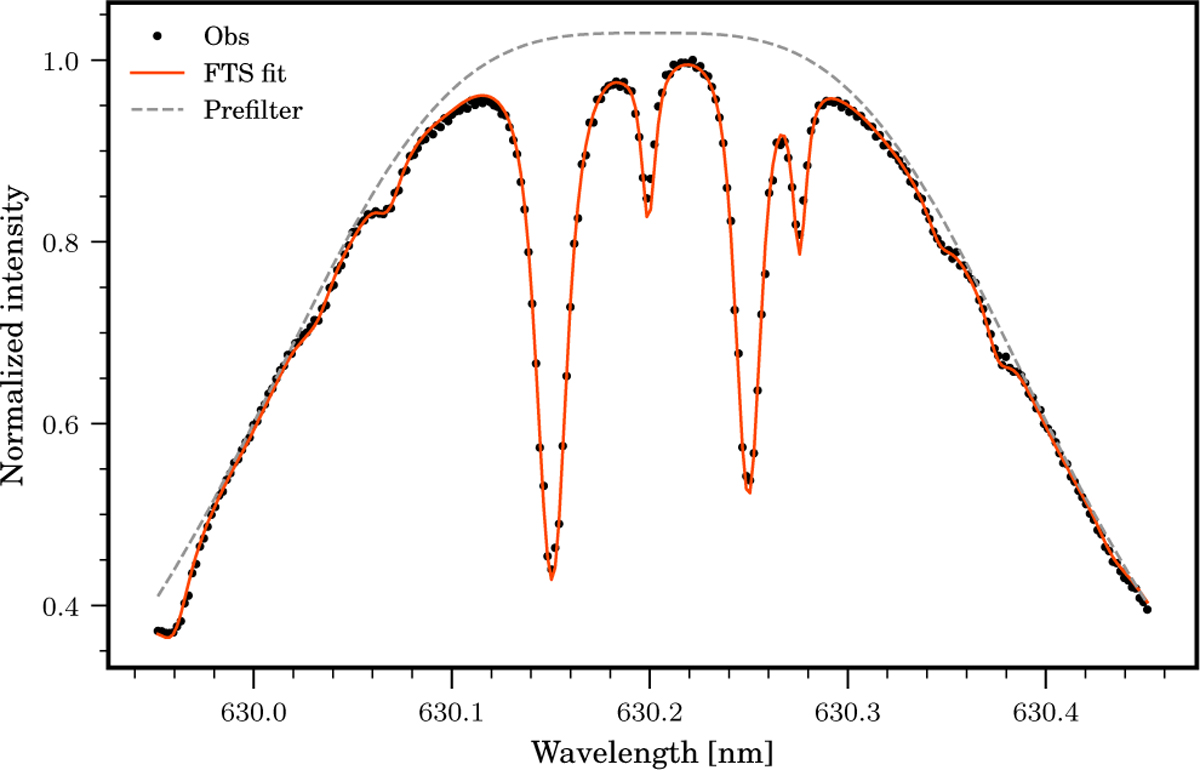
Averaged scans of a spectral region of the solar Fe I lines and the telluric lines around 630.2 nm recorded with CRISP (dots) together with the scanned FTS spectrum of Neckel & Labs (1984), degraded by the transmission profile of CRISP, as determined from fits of the reflectivities and cavity errors shown in Fig. 2. The dashed curve corresponds to the transmission curve of the prefilter, as obtained from the same data.
Current usage metrics show cumulative count of Article Views (full-text article views including HTML views, PDF and ePub downloads, according to the available data) and Abstracts Views on Vision4Press platform.
Data correspond to usage on the plateform after 2015. The current usage metrics is available 48-96 hours after online publication and is updated daily on week days.
Initial download of the metrics may take a while.