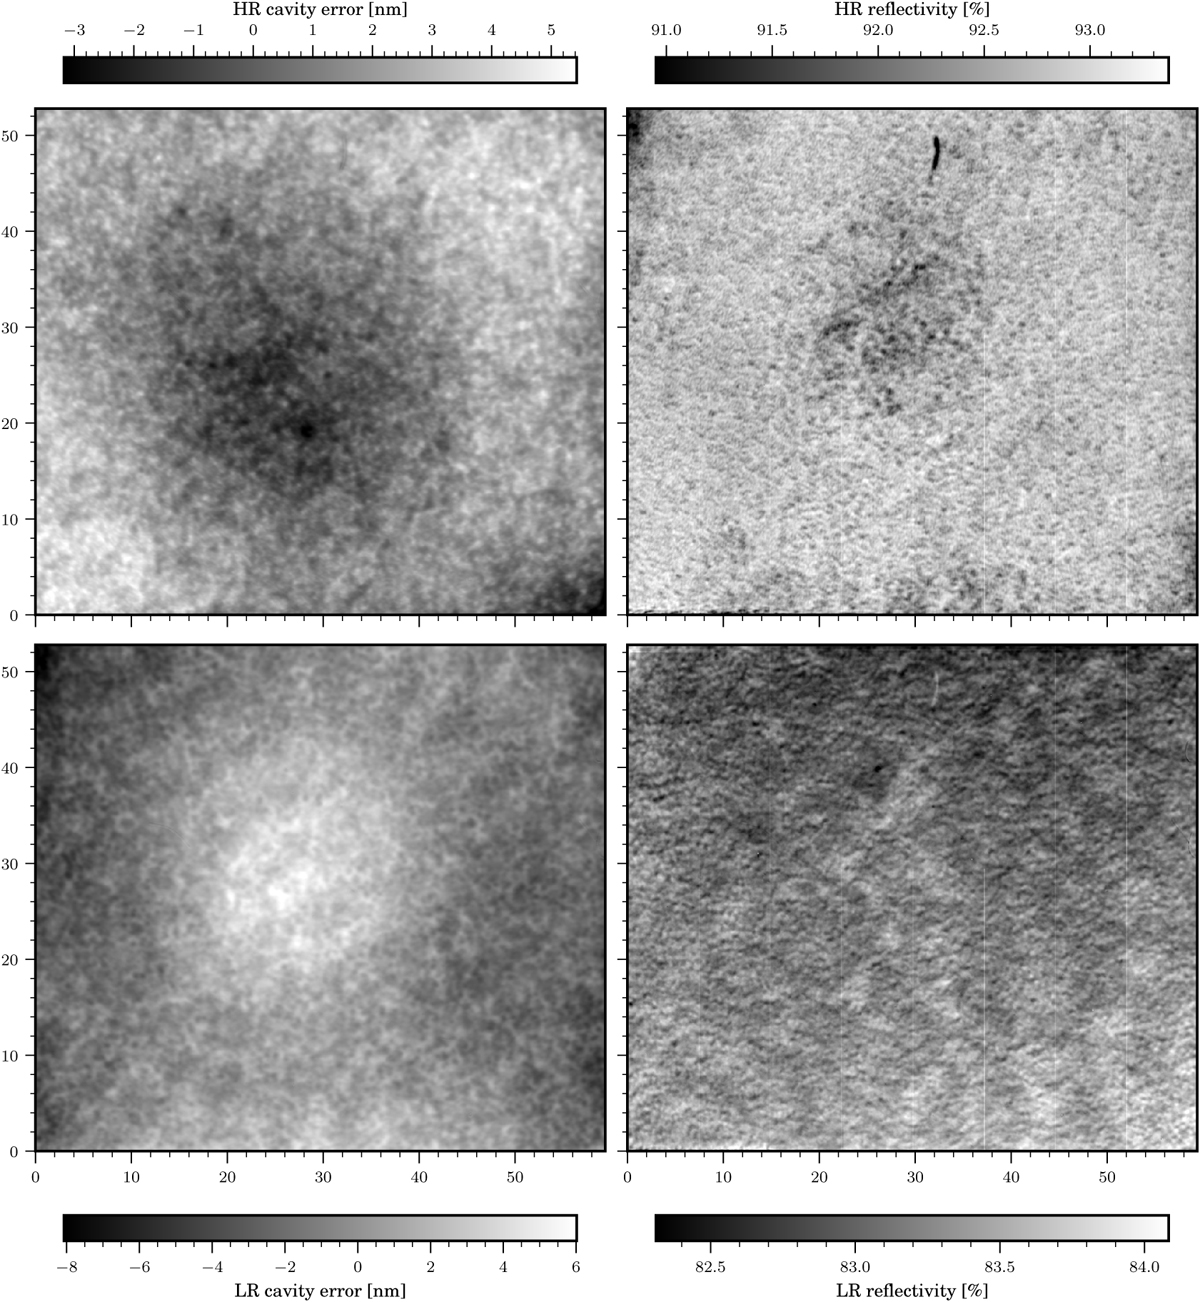
Fig. 2
Download original image
Cavity maps and reflectivity maps of the high-resolution (HR) and low-resolution (LR) etalons of CRISP, obtained by first recording images while scanning the two etalons together, then scanning the LR etalon across the passband of the HR etalon tuned to a continuum wavelength, and finally fitting the scanned profiles from the Fourier Transform Spectrometer at the McMath-Pierce Telescope (Neckel & Labs 1984).
Current usage metrics show cumulative count of Article Views (full-text article views including HTML views, PDF and ePub downloads, according to the available data) and Abstracts Views on Vision4Press platform.
Data correspond to usage on the plateform after 2015. The current usage metrics is available 48-96 hours after online publication and is updated daily on week days.
Initial download of the metrics may take a while.