Fig. 3
Download original image
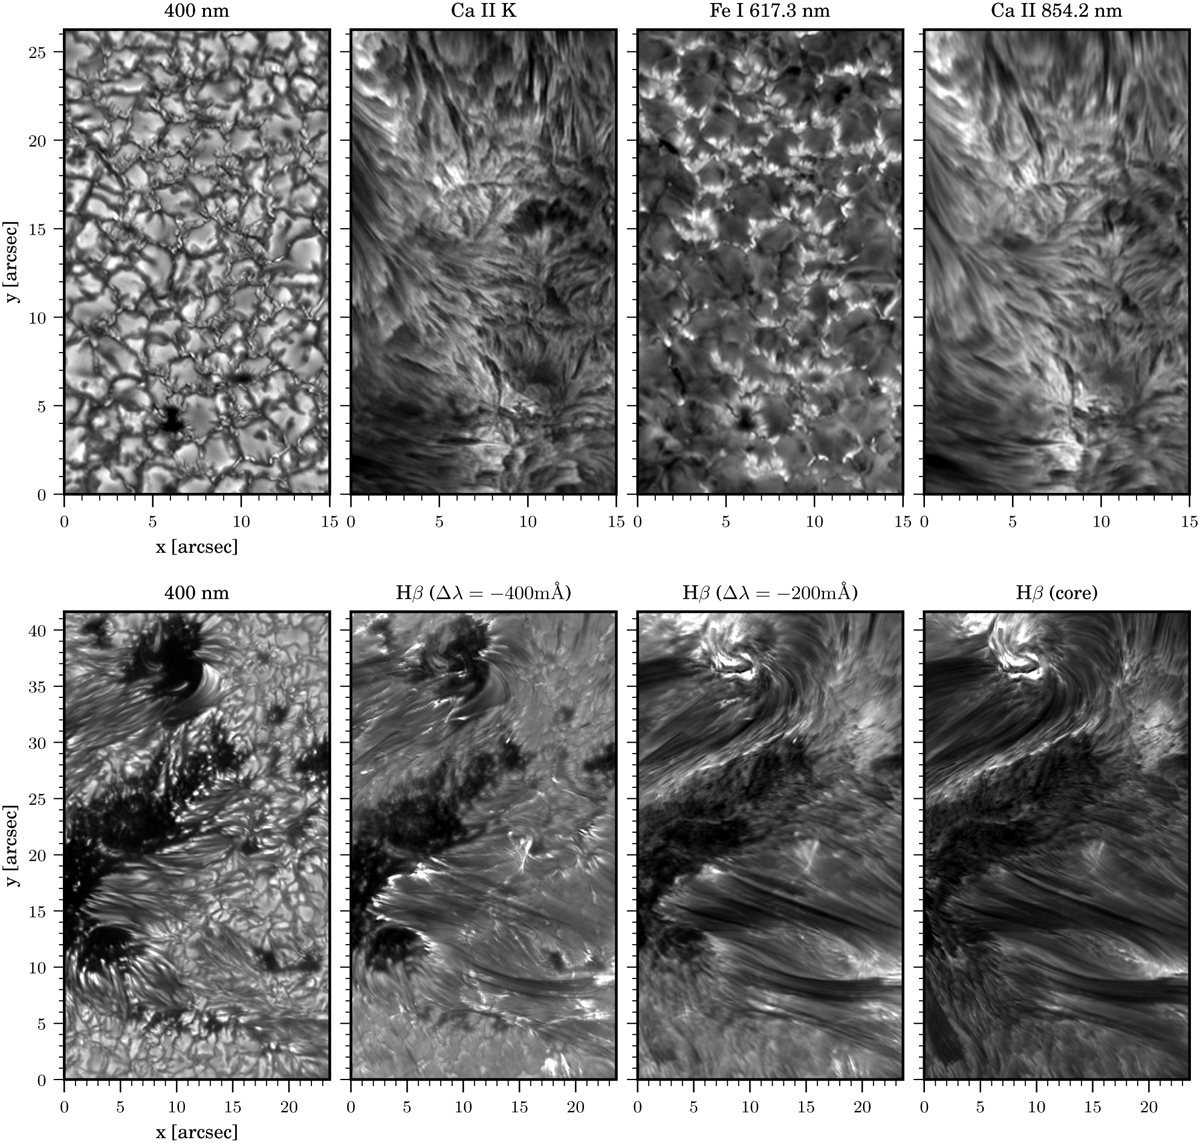
Collage of high-resolution CRISP and CHROMIS images showing a plage (top) and parts of active regions (bottom). The 400 nm (clean continuum), line core Ca II K, and Hβ images were recorded with CHROMIS, the Fe I 617.3 nm and Ca II 854.2 nm images are line core images recorded with CRISP. These images, selected from multi-wavelength scans through the corresponding spectral lines, illustrate the wide range of multi-line diagnostics possible by combining data from CRISP and CHROMIS, and the quality of the data.
Current usage metrics show cumulative count of Article Views (full-text article views including HTML views, PDF and ePub downloads, according to the available data) and Abstracts Views on Vision4Press platform.
Data correspond to usage on the plateform after 2015. The current usage metrics is available 48-96 hours after online publication and is updated daily on week days.
Initial download of the metrics may take a while.