Fig. 5
Download original image
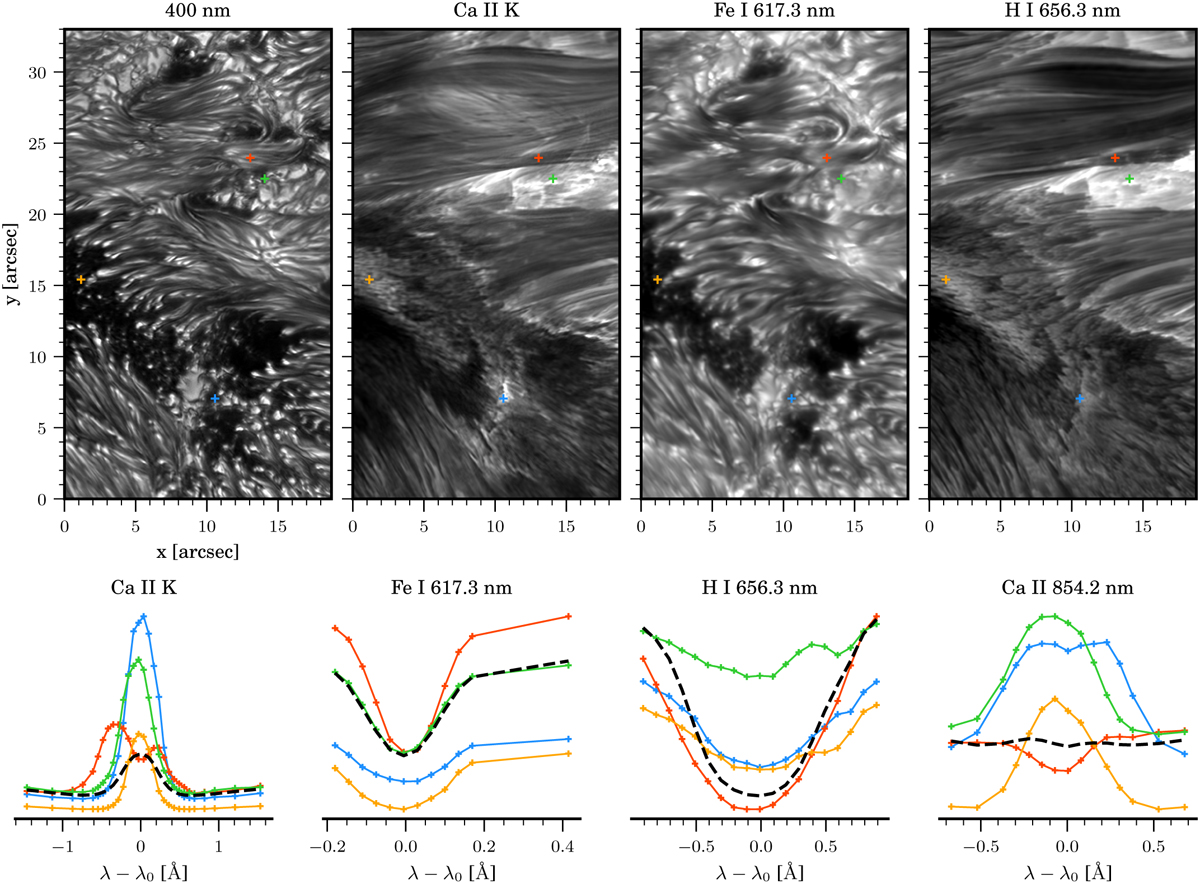
High-resolution CHROMIS (400 nm and Ca II K) and CRISP (617.3 nm and Hα 656.3 nm) images displaying the photospheric and chromospheric fine structure of an active region. The lower four panels show the corresponding full spectral scans through the cores of the same spectral lines, and also that of the Ca II 854.2 nm lines at four spatial locations indicated by colours that correspond to those of the spectral scans. The black dashed line corresponds to the line profile averaged over the entire FOV. The data shown are from Leenaarts et al. (2025).
Current usage metrics show cumulative count of Article Views (full-text article views including HTML views, PDF and ePub downloads, according to the available data) and Abstracts Views on Vision4Press platform.
Data correspond to usage on the plateform after 2015. The current usage metrics is available 48-96 hours after online publication and is updated daily on week days.
Initial download of the metrics may take a while.