Fig. 1.
Download original image
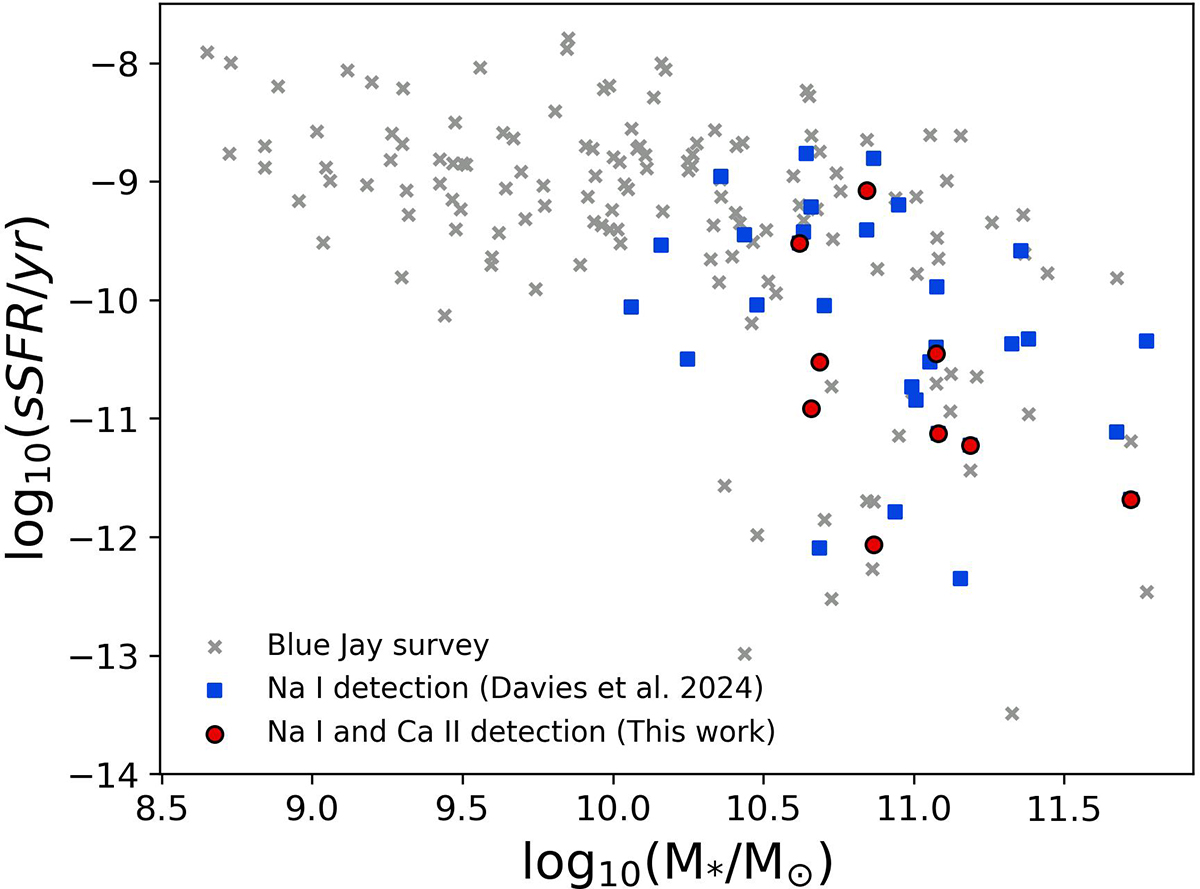
Distribution of stellar mass and sSFR for 141 galaxies from the Blue Jay survey. Gray crosses mark systems with no detection of excess Na I D absorption. Blue squares represent the sample of galaxies with excess Na I D absorption due to neutral gas studied by Davies et al. (2024). The galaxies analyzed in the present work are represented by red circles, and they have both Na I and Ca II absorption excess clearly detected.
Current usage metrics show cumulative count of Article Views (full-text article views including HTML views, PDF and ePub downloads, according to the available data) and Abstracts Views on Vision4Press platform.
Data correspond to usage on the plateform after 2015. The current usage metrics is available 48-96 hours after online publication and is updated daily on week days.
Initial download of the metrics may take a while.