Open Access
Fig. 11.
Download original image
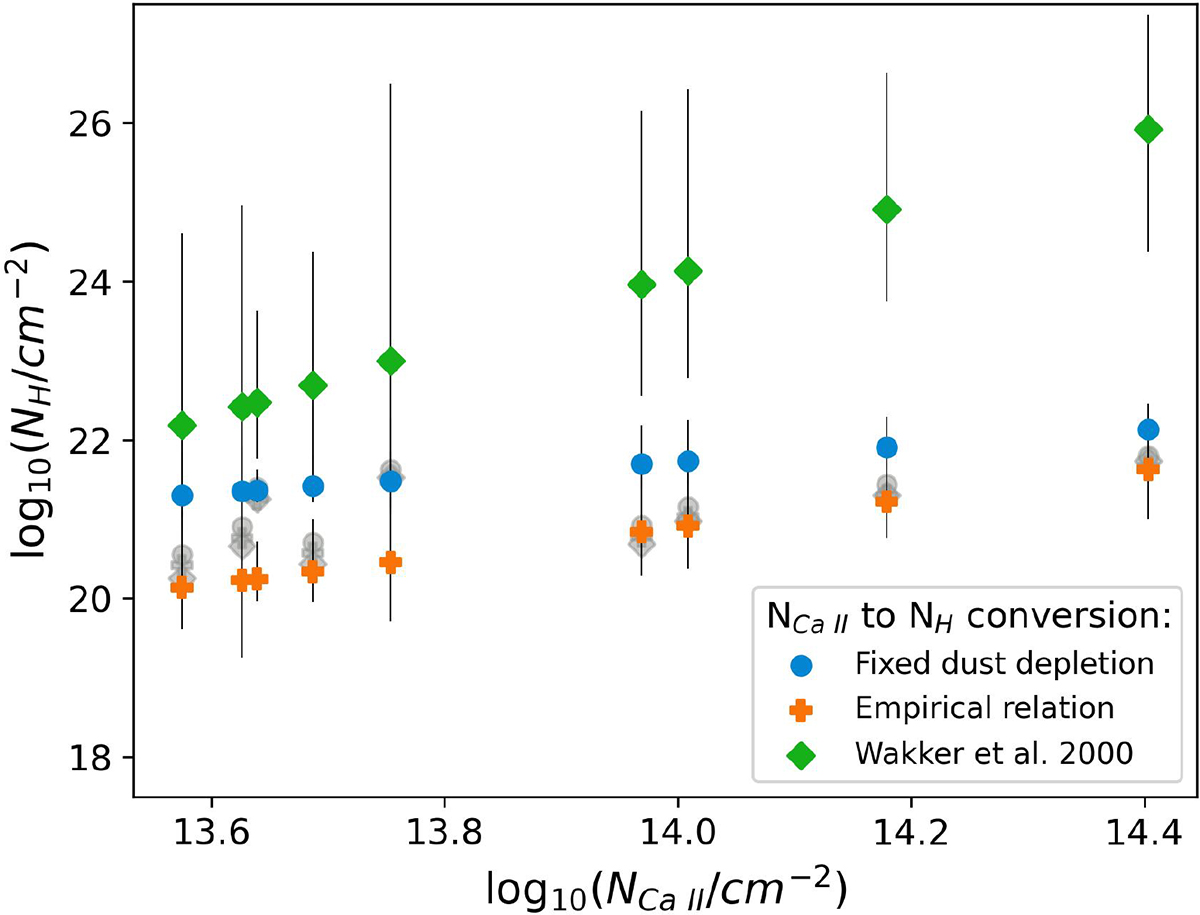
Comparison between log(NH I) inferred by different equations as a function of log(NCa II). The three methods, and the corresponding equations, are described in Section 6.1. Gray points on the background are the measure of log(NH I) based on Na I absorption lines for each equation.
Current usage metrics show cumulative count of Article Views (full-text article views including HTML views, PDF and ePub downloads, according to the available data) and Abstracts Views on Vision4Press platform.
Data correspond to usage on the plateform after 2015. The current usage metrics is available 48-96 hours after online publication and is updated daily on week days.
Initial download of the metrics may take a while.