Fig. 3.
Download original image
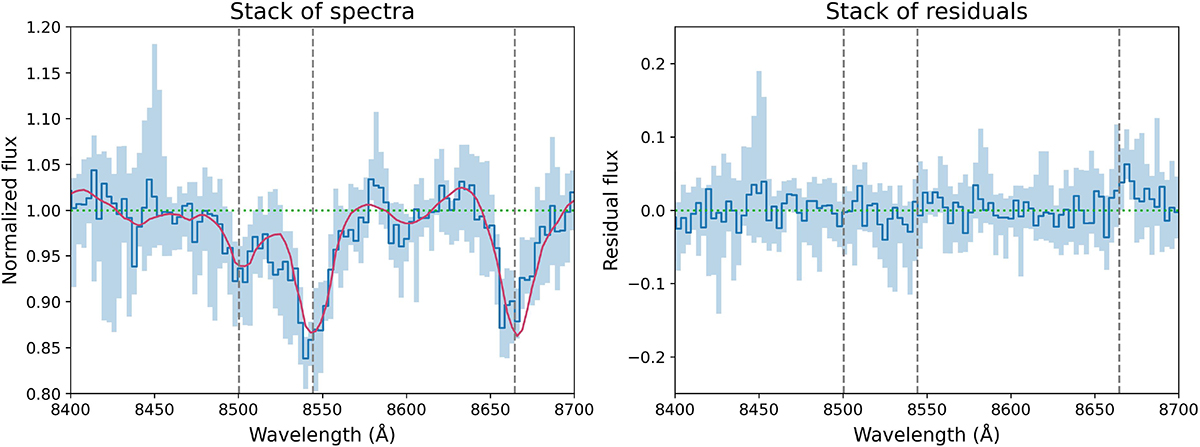
Stack of Ca II triplet lines for the sample galaxies. Left panel: Stack of the observed spectra (blue) and stack of the Prospector stellar models (dark pink) for the nine galaxies in the sample, around the Ca II triplet. The stack is normalized so that the level of the continuum is approximately 1. The Ca II triplet is precisely reproduced by the stellar models. Right panel: Stack of the residuals, i.e., observed spectra divided by their best-fit stellar models. The dashed vertical lines mark the wavelengths of the absorption lines that are part of the Ca II triplet. Shaded areas represent the 1σ uncertainty.
Current usage metrics show cumulative count of Article Views (full-text article views including HTML views, PDF and ePub downloads, according to the available data) and Abstracts Views on Vision4Press platform.
Data correspond to usage on the plateform after 2015. The current usage metrics is available 48-96 hours after online publication and is updated daily on week days.
Initial download of the metrics may take a while.