Fig. 5.
Download original image
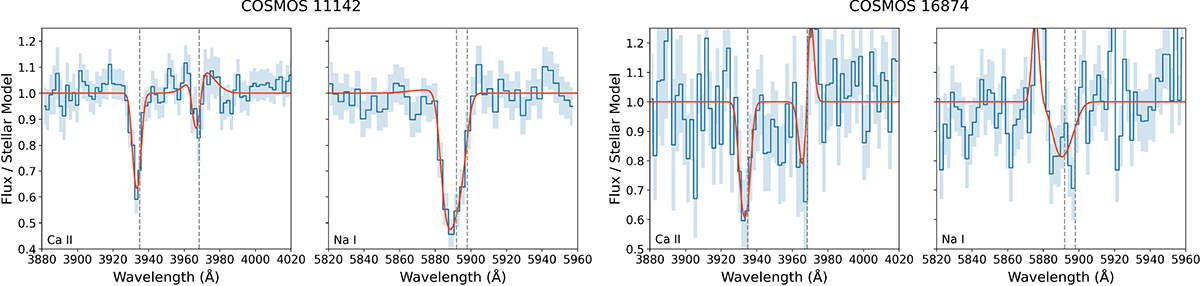
Observed NIRSpec spectra divided by their stellar continuum (blue), with the best-fit model (orange) for galaxies 11142 and 16874. The blue shadow is the flux uncertainty. For each galaxy the left panel shows the Ca II K, H absorption and Hϵ emission, while the right panel shows the Na I D absorption and He I emission. The dashed vertical lines mark the systemic wavelength of the absorption lines.
Current usage metrics show cumulative count of Article Views (full-text article views including HTML views, PDF and ePub downloads, according to the available data) and Abstracts Views on Vision4Press platform.
Data correspond to usage on the plateform after 2015. The current usage metrics is available 48-96 hours after online publication and is updated daily on week days.
Initial download of the metrics may take a while.