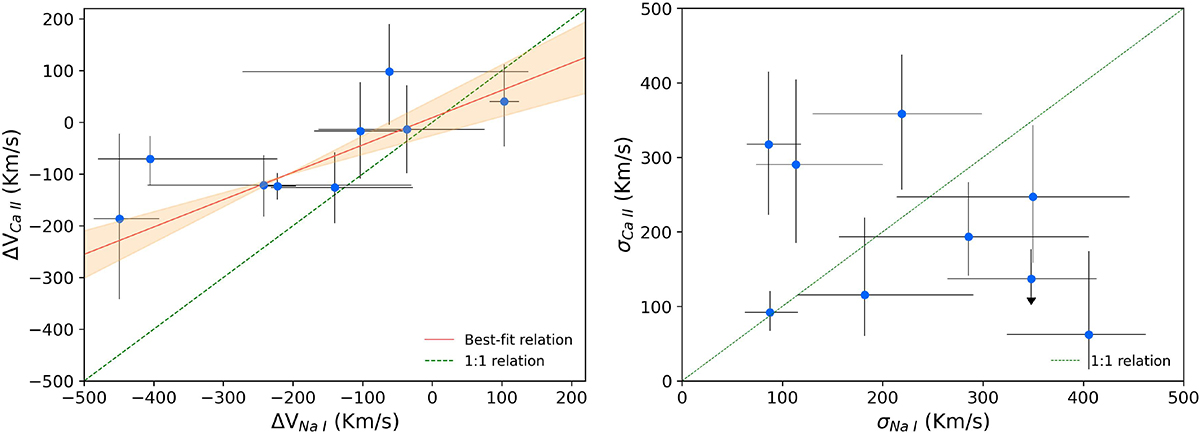
Fig. 6.
Download original image
Kinematic properties of neutral gas. Left panel: Velocity shifts for neutral gas measured from Ca II vs. Na I. Error bars correspond to the 16th and the 84th percentile of the probability distribution function from emcee. The red line represents the best-fit linear relation of the measurements weighted by their errors, while the orange shadow is the 1σ error of the best-fit line. Right panel: Velocity dispersions of neutral gas inferred from Ca II vs. Na I. The dashed green line represents the 1:1 relation. The velocity dispersion of Ca II lines of COSMOS-18668 is only an upper limit represented by an arrow.
Current usage metrics show cumulative count of Article Views (full-text article views including HTML views, PDF and ePub downloads, according to the available data) and Abstracts Views on Vision4Press platform.
Data correspond to usage on the plateform after 2015. The current usage metrics is available 48-96 hours after online publication and is updated daily on week days.
Initial download of the metrics may take a while.