Fig. 10
Download original image
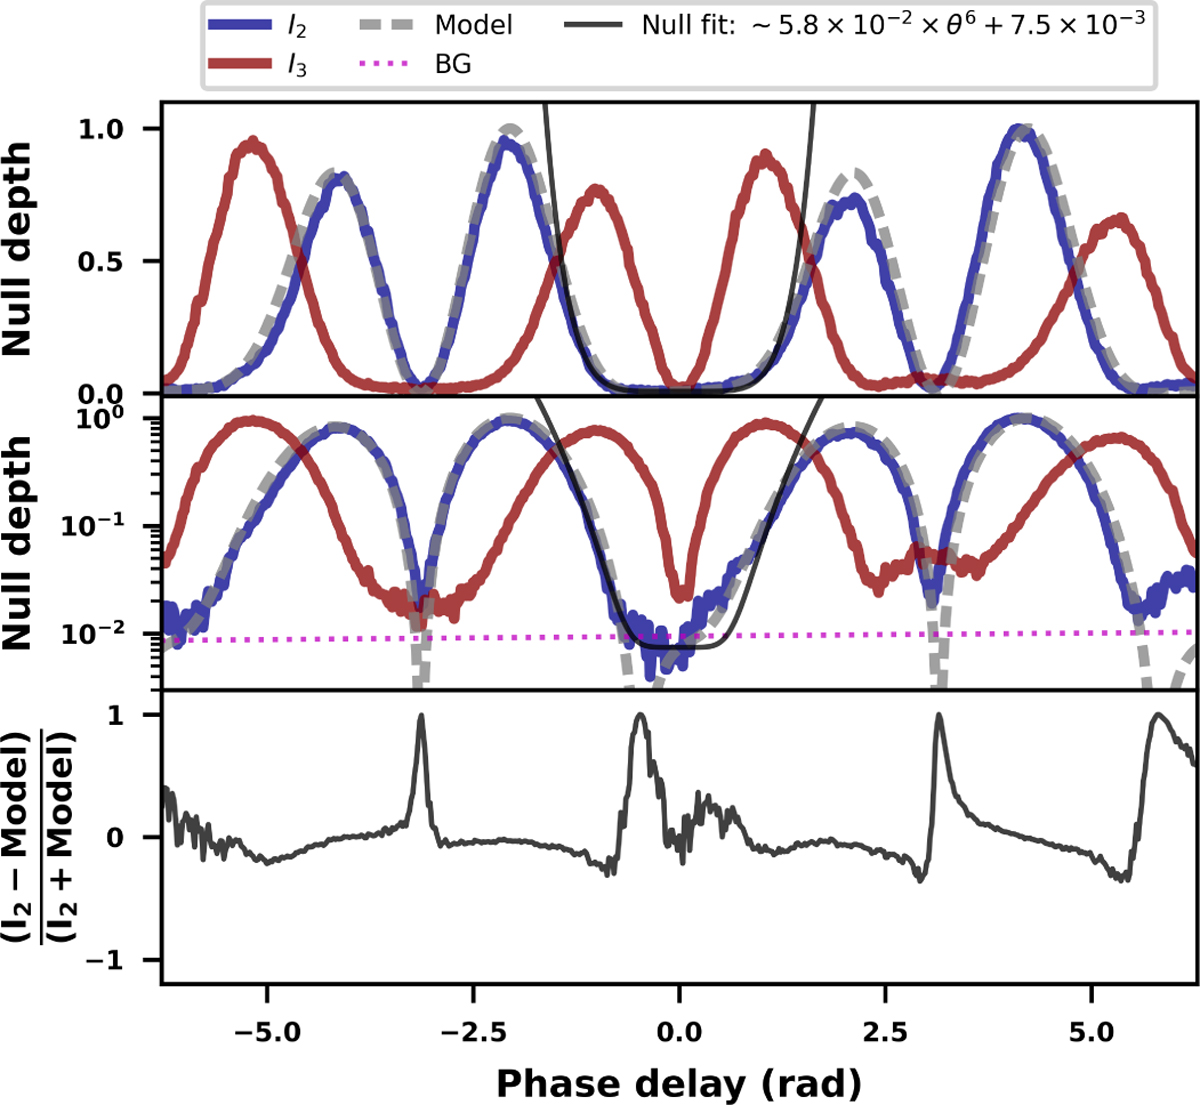
Transmission curves as a function of the phase delay of outputs I2 and I3, respectively shown in blue and red, from the star transit simulation experiment, displayed in linear (top) and logarithmic scale (middle). The modified transmission model adapted from Angel & Woolf (1997) and fit to the data is overlaid as a dashed gray line. The fit of the left part of the central broad null by a polynomial function is shown as a black continuous line. The background level is indicated with a dotted magenta line. The bottom plot shows the normalized fit residuals between the blue and gray dashed lines.
Current usage metrics show cumulative count of Article Views (full-text article views including HTML views, PDF and ePub downloads, according to the available data) and Abstracts Views on Vision4Press platform.
Data correspond to usage on the plateform after 2015. The current usage metrics is available 48-96 hours after online publication and is updated daily on week days.
Initial download of the metrics may take a while.