Fig. 1.
Download original image
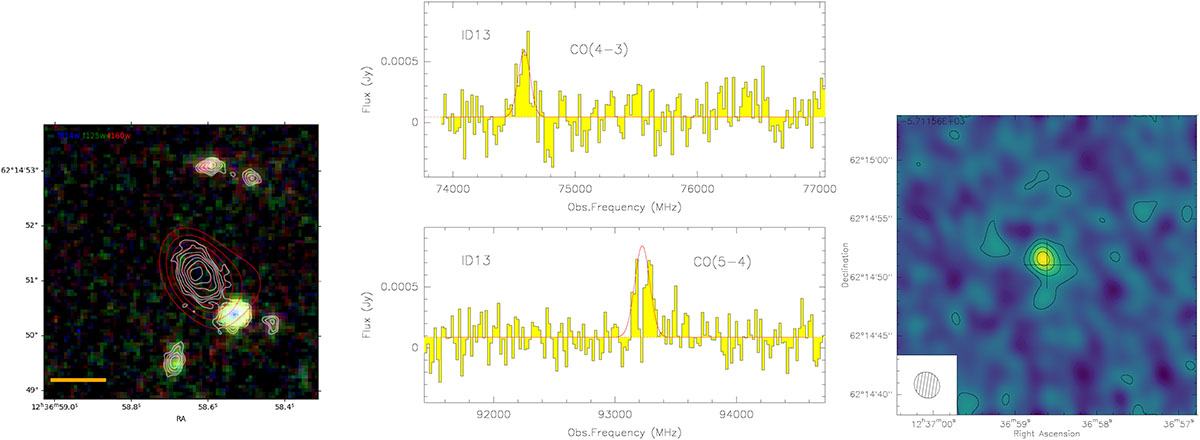
N2GN_1_13. Left: False colour image produced using HST data, with F814W, F125W, and F160W images in blue, green, and red, respectively. Overlaid in red are the NOEMA continuum contours at 2 mm, ranging from 4σ to 14σ in steps of 2. The white contours are JWST F444W brightness. The scale bar in the bottom left has a length of 1″. Middle: NOEMA CO(4−3) and CO(5−4) line spectra. The red line shows the Gaussian fit to the line profile (including the continuum). Notice that the CO(5−4) line lies precisely at the interface between two basebands, resulting in the partial fragmentation of the spectral profile. Right: NOEMA 3.5 mm continuum map. Contours are displayed with a step of 12 μJy/beam (corresponding to 2σ).
Current usage metrics show cumulative count of Article Views (full-text article views including HTML views, PDF and ePub downloads, according to the available data) and Abstracts Views on Vision4Press platform.
Data correspond to usage on the plateform after 2015. The current usage metrics is available 48-96 hours after online publication and is updated daily on week days.
Initial download of the metrics may take a while.