Fig. A.1.
Download original image
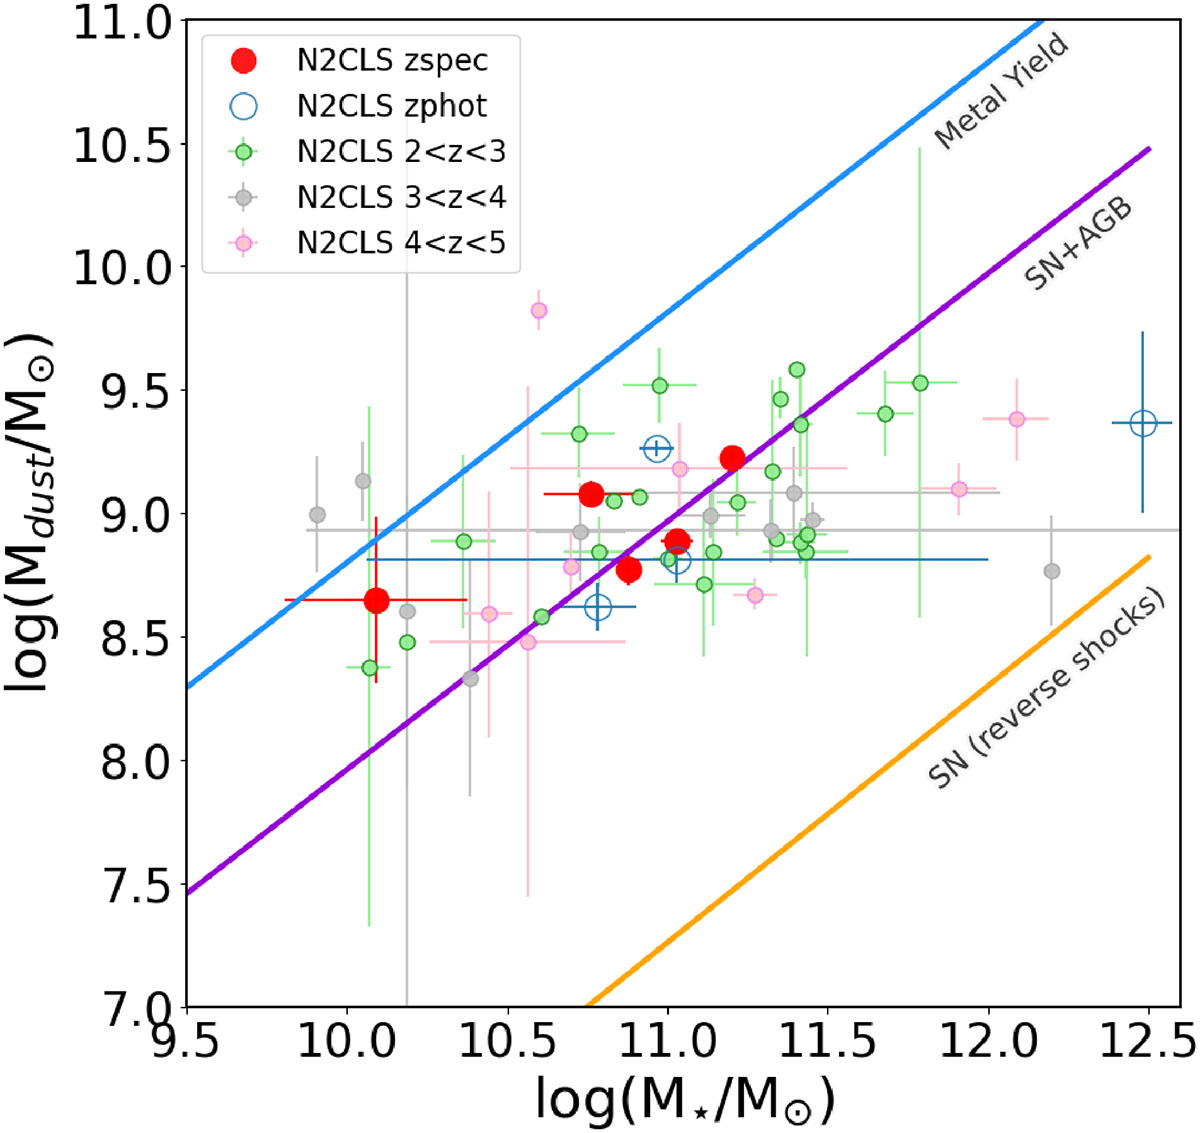
Dust mass versus stellar mass for N2CLS galaxies. Filled red circles represent the five DSFGs with spectroscopic redshifts at z ∼ 5.2, while open blue circles indicate those with photometric redshifts (including the very massive N2GN_1_20 galaxy discussed in Appendix D). For comparison, we also show all N2CLS galaxies at 2 < z < 5 from Berta et al. (2025). The region between the orange and purple lines is the expected dust mass range assuming a maximal dust production from both AGB stars and supernovae (SN), without significant reverse-shock destruction. The area below the orange line represents the same scenario, but accounting for ∼95% reverse-shock destruction. The blue line shows the upper limit on dust mass based on the highest metal yields from Witstok et al. (2023), i.e. the extreme case of metal accretion onto dust grains resulting in maximal grain growth.
Current usage metrics show cumulative count of Article Views (full-text article views including HTML views, PDF and ePub downloads, according to the available data) and Abstracts Views on Vision4Press platform.
Data correspond to usage on the plateform after 2015. The current usage metrics is available 48-96 hours after online publication and is updated daily on week days.
Initial download of the metrics may take a while.