Open Access
Fig. 1
Download original image
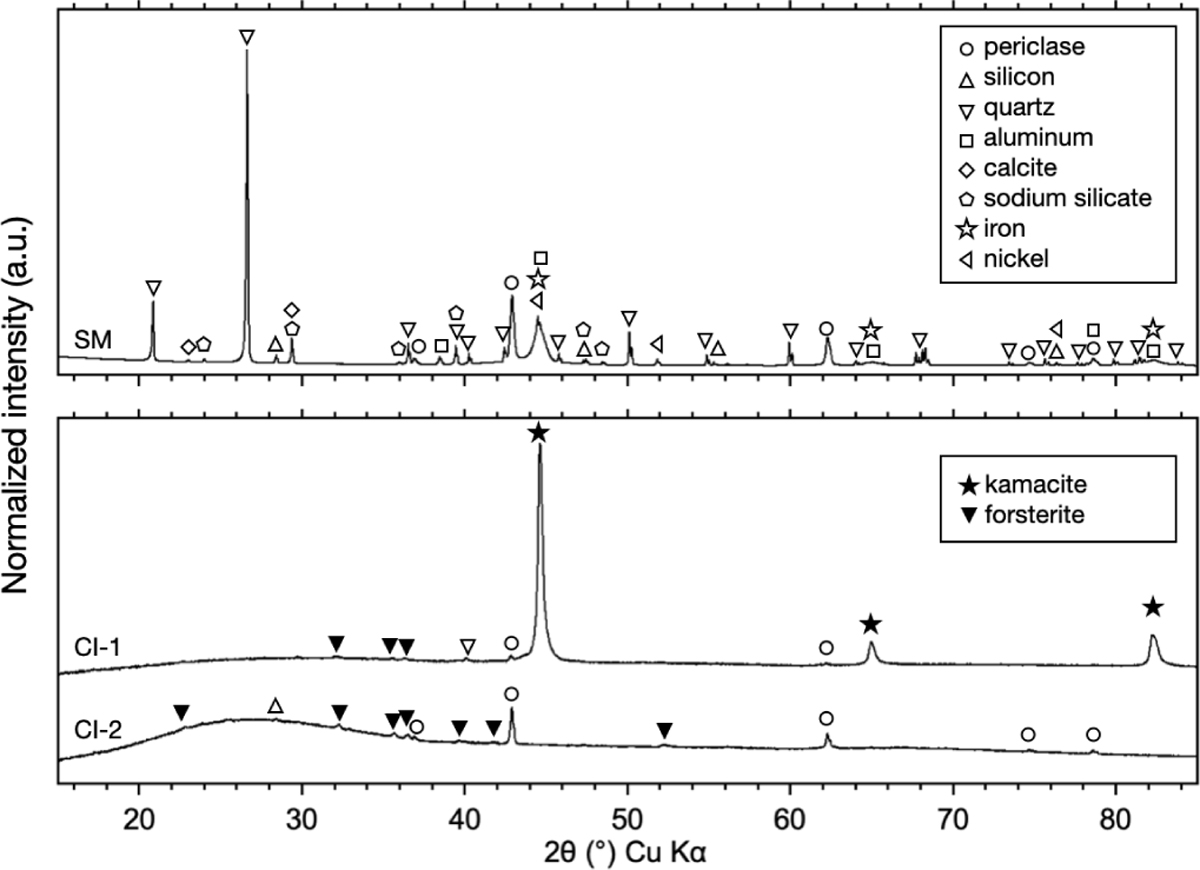
XRD patterns of the starting material of CI-1 (upper panel) and experimental products (CI-1, CI-2; bottom panel). Peaks indicated by open symbols are derived from the reagents composing the starting material. Filled symbols show the peaks of new phases formed through the condensation.
Current usage metrics show cumulative count of Article Views (full-text article views including HTML views, PDF and ePub downloads, according to the available data) and Abstracts Views on Vision4Press platform.
Data correspond to usage on the plateform after 2015. The current usage metrics is available 48-96 hours after online publication and is updated daily on week days.
Initial download of the metrics may take a while.