Fig. 1
Download original image
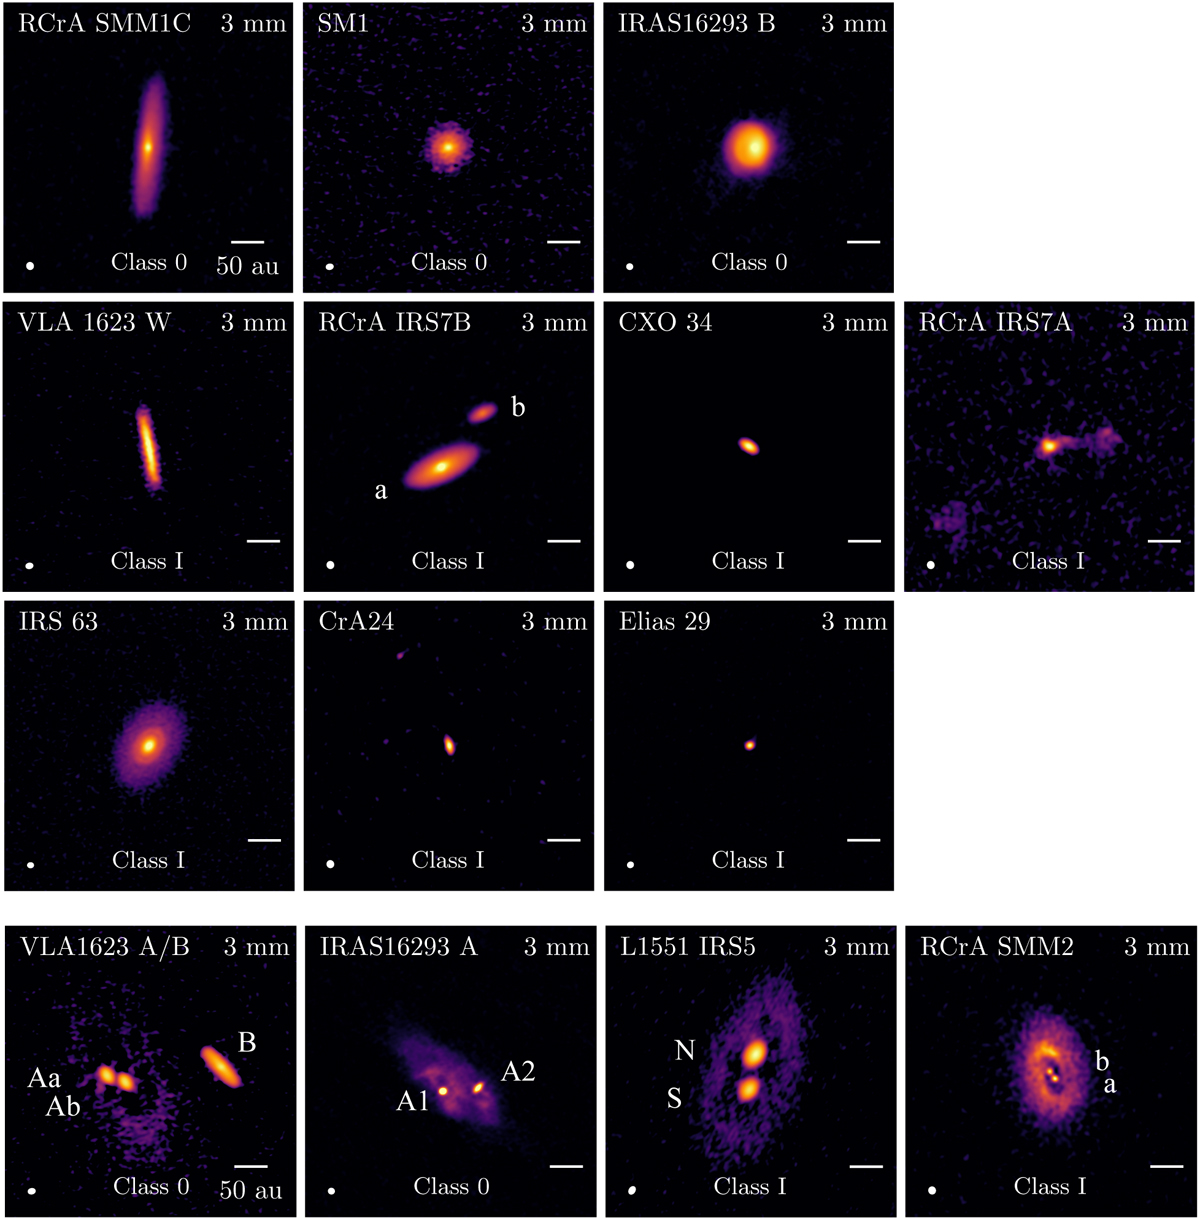
ALMA 3 mm images of all the sources in our sample at the same physical scale. The emission is presented with a log stretch to enhance the weaker extended emission. The images are organized in two groups. The first one (top three rows) corresponds to all the systems in which the projected separation to the nearest protostellar neighbor is larger than 100 au, while the second one (bottom row) comprises the systems with a protostellar neighbor below 100 au. Unlike the first group, disk-like circumbinary structures are observed for all sources in the second group. For each group the sources are organized by increasing bolometric temperature.
Current usage metrics show cumulative count of Article Views (full-text article views including HTML views, PDF and ePub downloads, according to the available data) and Abstracts Views on Vision4Press platform.
Data correspond to usage on the plateform after 2015. The current usage metrics is available 48-96 hours after online publication and is updated daily on week days.
Initial download of the metrics may take a while.