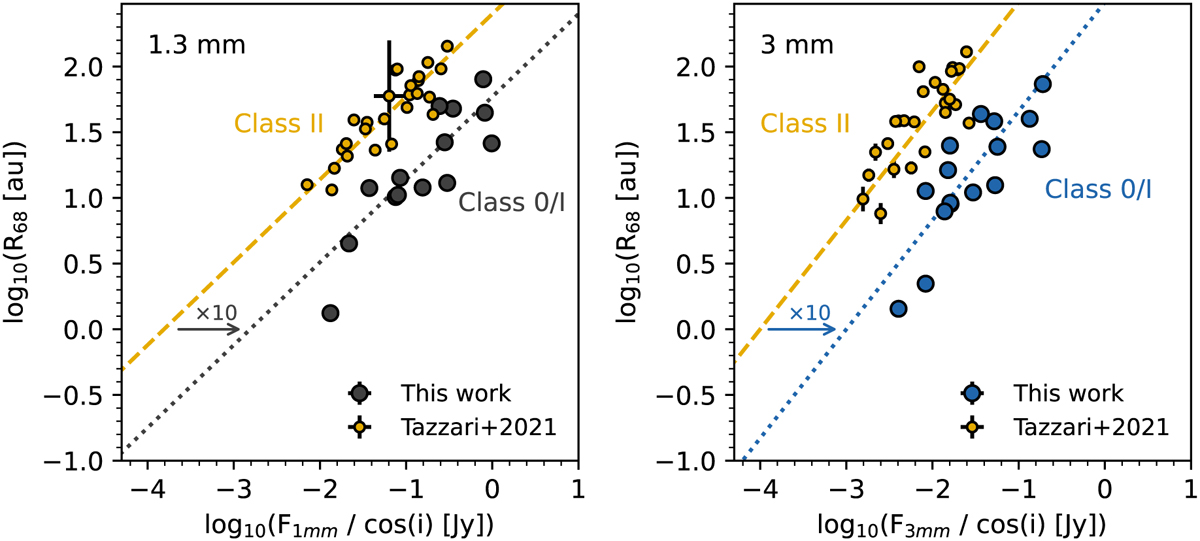
Fig. 10
Download original image
Size and luminosity relations at 1.3 and 3 mm (circles). Left: R68 vs. flux at 1.3 mm. Right: R68 vs. flux at 3 mm. Fluxes in both panels have a correction for inclination that is valid for optically thick emission. The dashed lines show the linear regression results for Class II sources at the two wavelengths, derived in Tazzari et al. (2021a), which also include the correction for optically thick emission. The dotted lines corresponds to the relation for Class II considering a shift in the fluxes of a factor of 10.
Current usage metrics show cumulative count of Article Views (full-text article views including HTML views, PDF and ePub downloads, according to the available data) and Abstracts Views on Vision4Press platform.
Data correspond to usage on the plateform after 2015. The current usage metrics is available 48-96 hours after online publication and is updated daily on week days.
Initial download of the metrics may take a while.