Fig. 14
Download original image
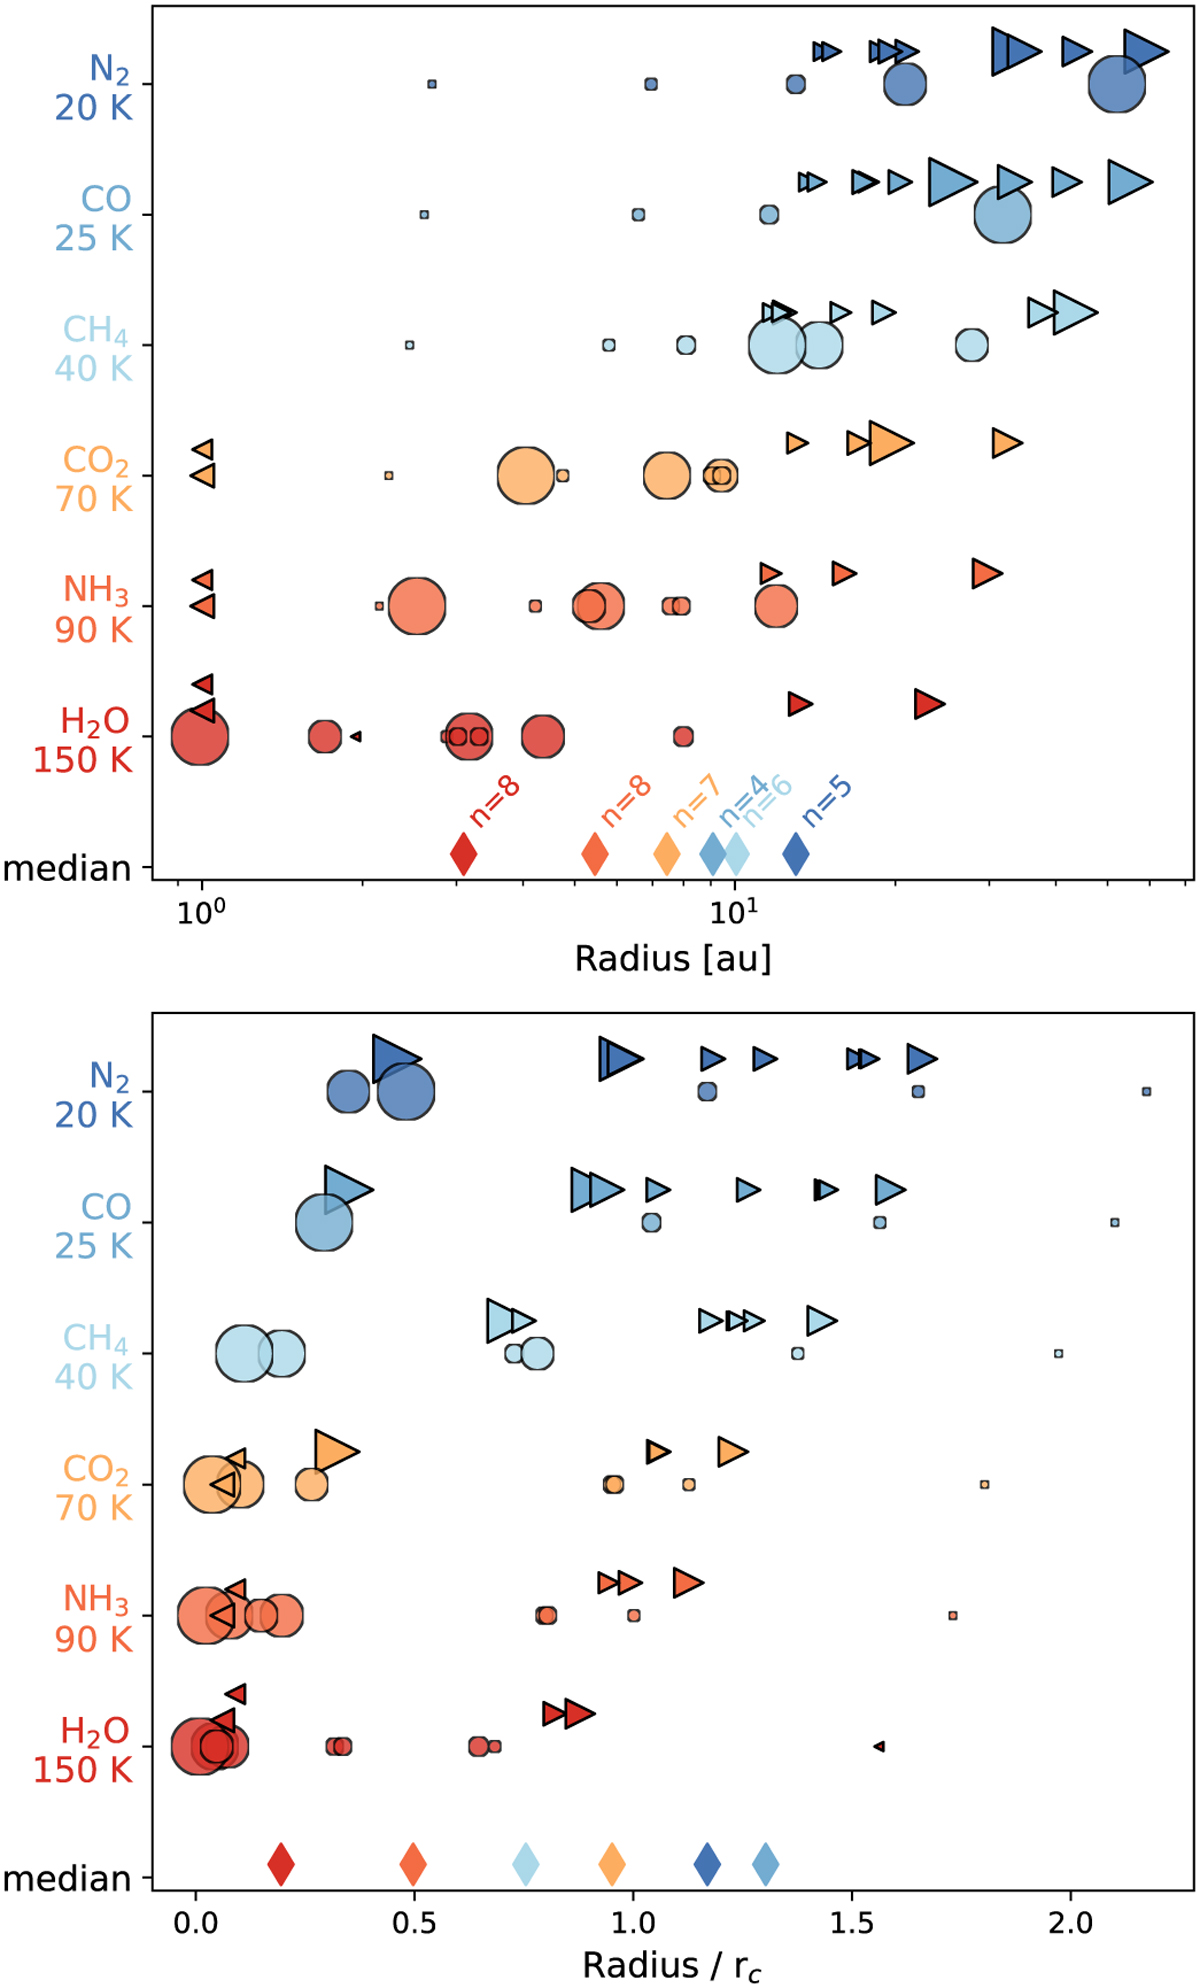
Location of different icelines in the observed Class 0/I disks derived from the fit intensity profiles at 1.3 mm. Top: location plotted as distance from the center of the disk. Bottom panel: location plotted as the radius of the iceline over the characteristic disk radius rc. The ‘◃’ and ‘▹’ symbols correspond to upper and lower limits, respectively. The sizes of the symbols are proportional to log10 rc. The median value for each iceline (ignoring upper/lower limits) is marked with a diamond symbol. The numbers of disks considered for the median is indicated next to diamond marker at the top panel. (See Section 6.3 for more details.
Current usage metrics show cumulative count of Article Views (full-text article views including HTML views, PDF and ePub downloads, according to the available data) and Abstracts Views on Vision4Press platform.
Data correspond to usage on the plateform after 2015. The current usage metrics is available 48-96 hours after online publication and is updated daily on week days.
Initial download of the metrics may take a while.