Fig. 15
Download original image
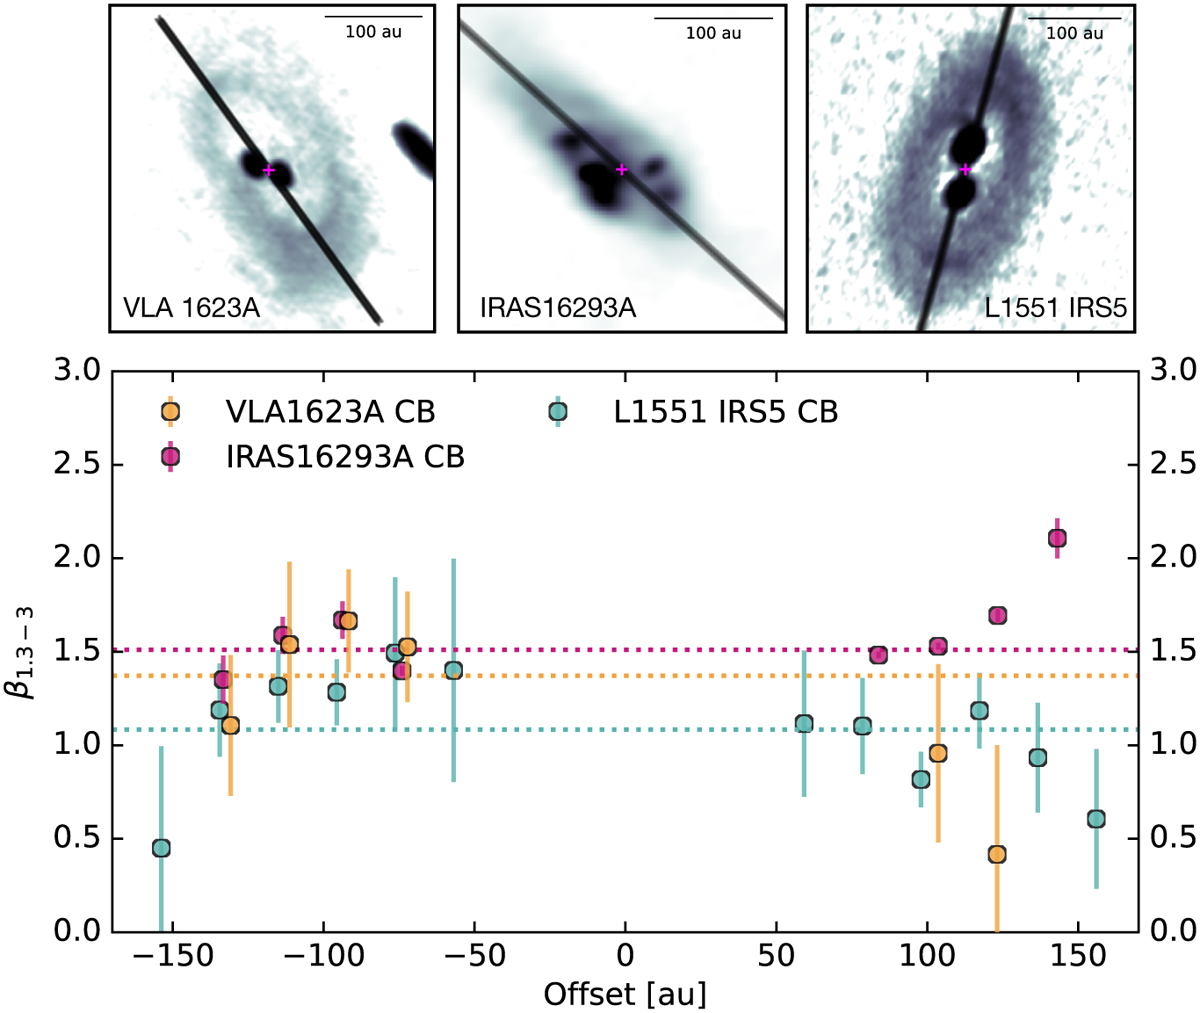
Derived β1.3–3 mm for the CBDs in the sample. The values are calculated for a cut centered at the midpoint between the CSDs, oriented along the CBD major axis. The cuts are displayed in the top panels. The dotted lines correspond to the mean value for each source. Positive offsets correspond to the eastern side of the cut. (See Section 6.5.2 for details.
Current usage metrics show cumulative count of Article Views (full-text article views including HTML views, PDF and ePub downloads, according to the available data) and Abstracts Views on Vision4Press platform.
Data correspond to usage on the plateform after 2015. The current usage metrics is available 48-96 hours after online publication and is updated daily on week days.
Initial download of the metrics may take a while.