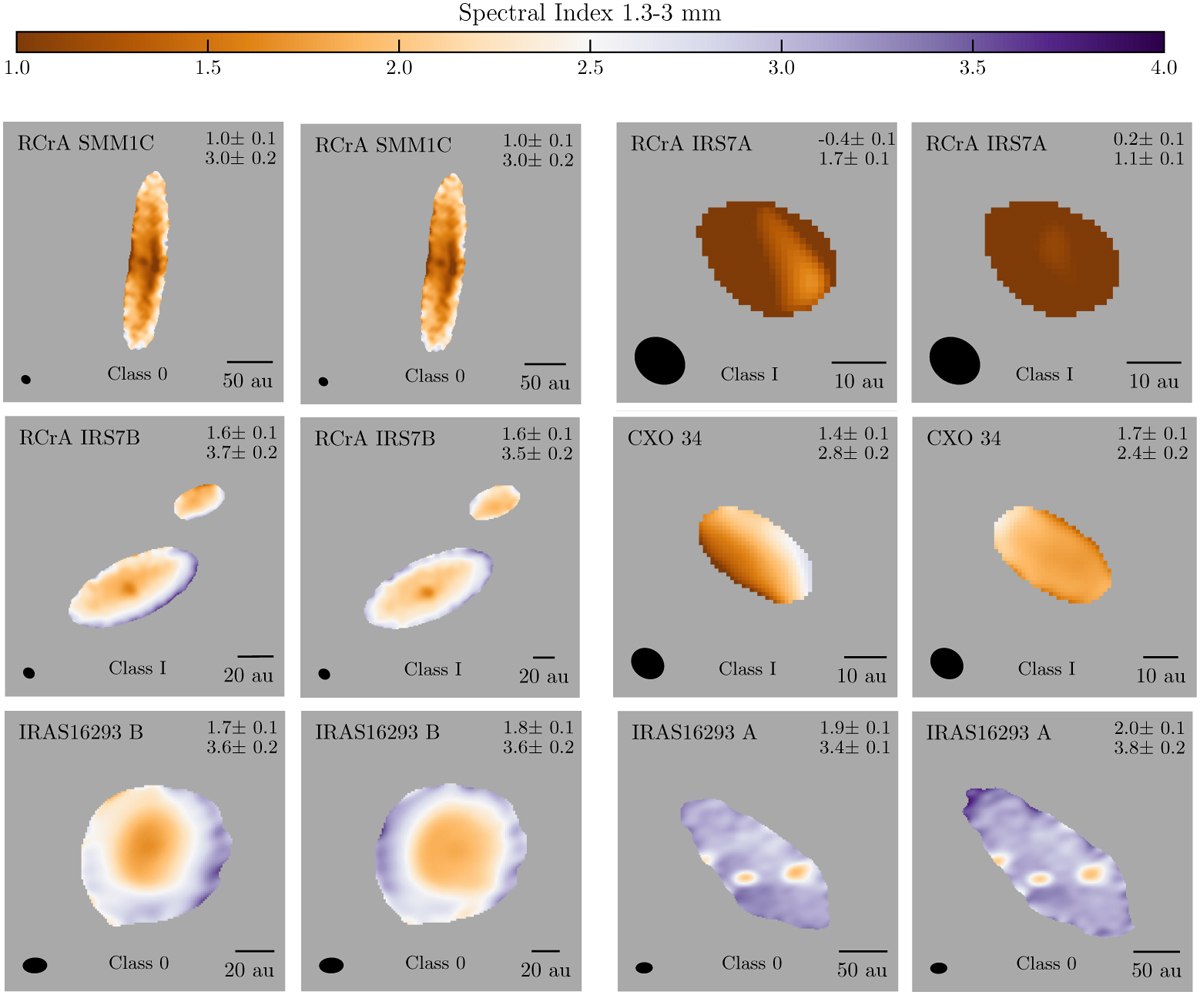
Fig. D.1
Download original image
Spectral index maps before and after applying a shift to the 1.3 mm image to correct for systematic gradients observed in the fields of Corona Australis and IRAS 16293 A/B (Ophiuchus). The left and right images correspond to before and after the correction, respectively. The upper-right corner contains the minimum and maximum values of the spectral index in the map, considering only the pixels with errors up to 0.2.
Current usage metrics show cumulative count of Article Views (full-text article views including HTML views, PDF and ePub downloads, according to the available data) and Abstracts Views on Vision4Press platform.
Data correspond to usage on the plateform after 2015. The current usage metrics is available 48-96 hours after online publication and is updated daily on week days.
Initial download of the metrics may take a while.