Open Access
Fig. G.1
Download original image
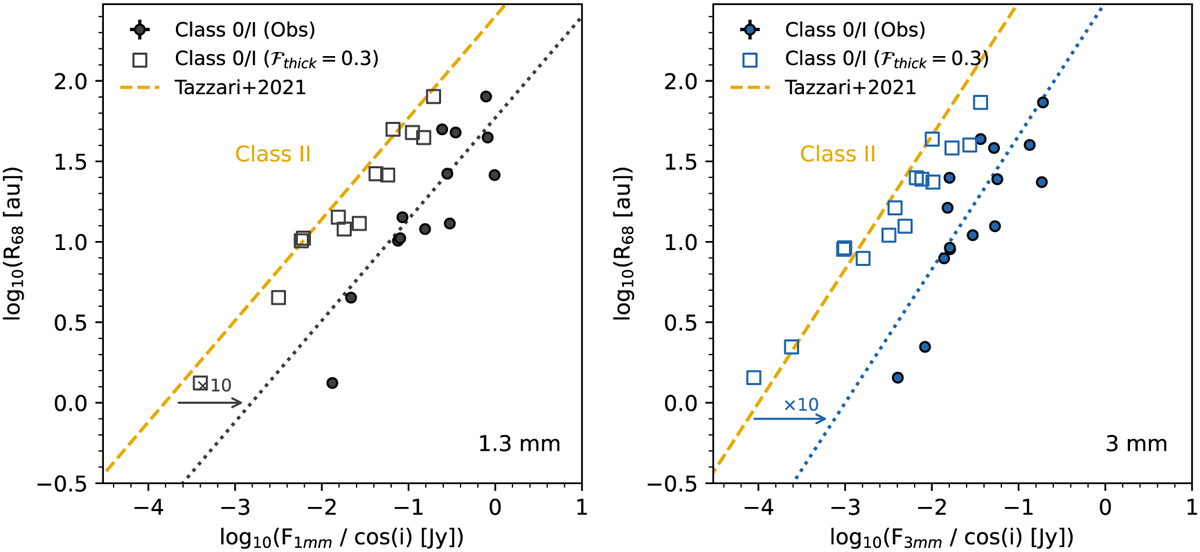
Comparison between the observed disk luminosity and the predicted values assuming ℱthick = 0.3 as in Andrews et al. (2018b) for Class II disks. Same as Figure 10. Filled circles are the observations and squares are the predicted luminosity for each disk if ℱthick = 0.3 of the flux if optically thick.
Current usage metrics show cumulative count of Article Views (full-text article views including HTML views, PDF and ePub downloads, according to the available data) and Abstracts Views on Vision4Press platform.
Data correspond to usage on the plateform after 2015. The current usage metrics is available 48-96 hours after online publication and is updated daily on week days.
Initial download of the metrics may take a while.