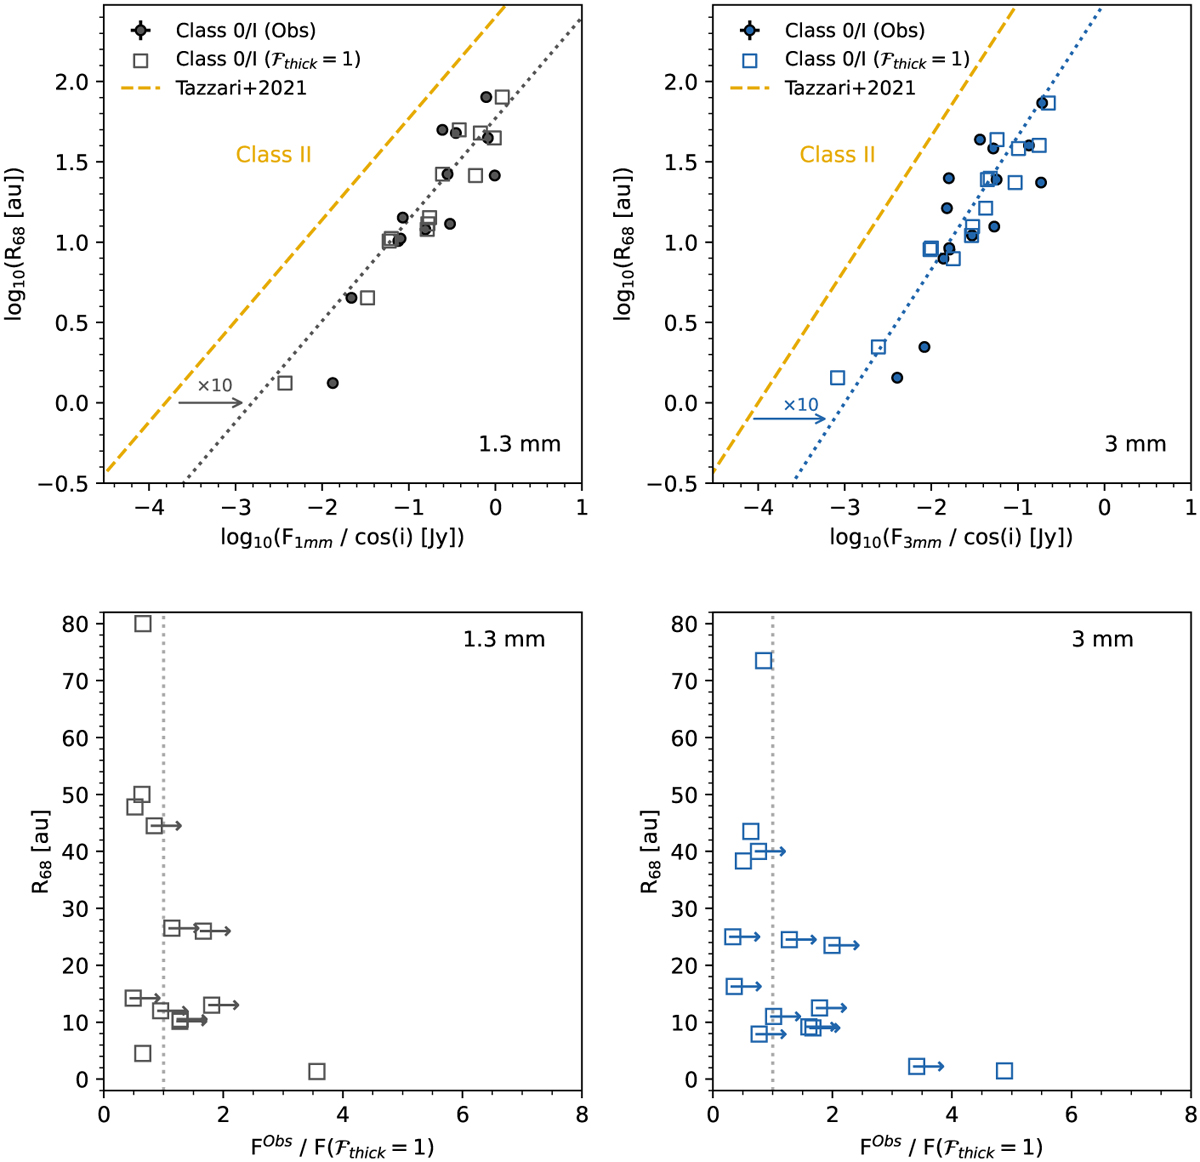
Fig. G.2
Download original image
Comparison between the observed disks luminosity and the predicted values assuming the disks are fully optically thick, considering a nonconstant flaring angle φ and L* = Lint. Top: Same as Figure 10. Filled circles are the observations and squares are the predicted luminosity for each disk if the emission is fully optically thick. Bottom: Size versus the ratio of the observed disk luminosity to the predicted one assuming the entire disk is optically thick. Lower limits for the ratio are due to the assumed internal luminosity being an upper limit.
Current usage metrics show cumulative count of Article Views (full-text article views including HTML views, PDF and ePub downloads, according to the available data) and Abstracts Views on Vision4Press platform.
Data correspond to usage on the plateform after 2015. The current usage metrics is available 48-96 hours after online publication and is updated daily on week days.
Initial download of the metrics may take a while.