Fig. I.1
Download original image
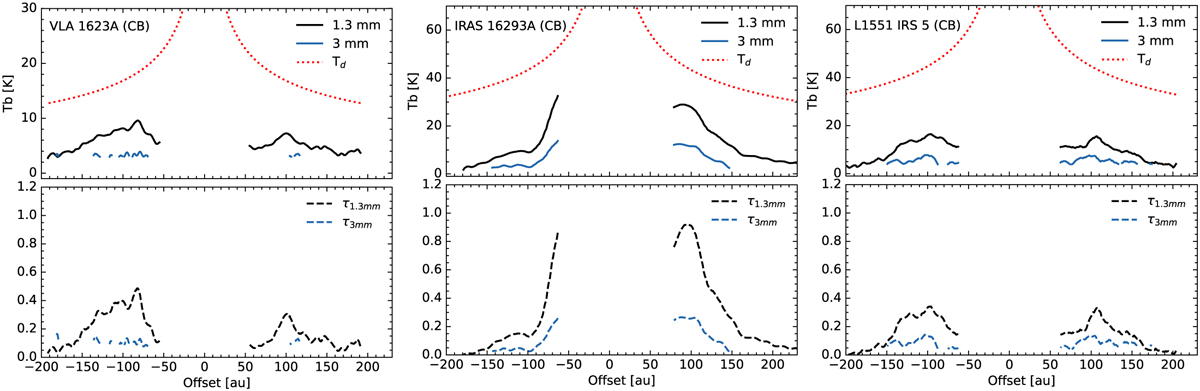
Intensity profiles in a cut along the major axis direction for the three CBDs in our sample observed at 1.3 and 3mm. The zero-offset corresponds to the mid-point between the circumstellar disks. Positive offsets track positive R.A. offsets. The red dotted line is the predicted temperature profile due to irradiation and the bottom panels show the resultant optical depth at each wavelength based on this temperature profile. The emission from the circumstellar disks or temperature substructures in the case of IRAS 162923A are masked out from the central region.
Current usage metrics show cumulative count of Article Views (full-text article views including HTML views, PDF and ePub downloads, according to the available data) and Abstracts Views on Vision4Press platform.
Data correspond to usage on the plateform after 2015. The current usage metrics is available 48-96 hours after online publication and is updated daily on week days.
Initial download of the metrics may take a while.