Fig. 5
Download original image
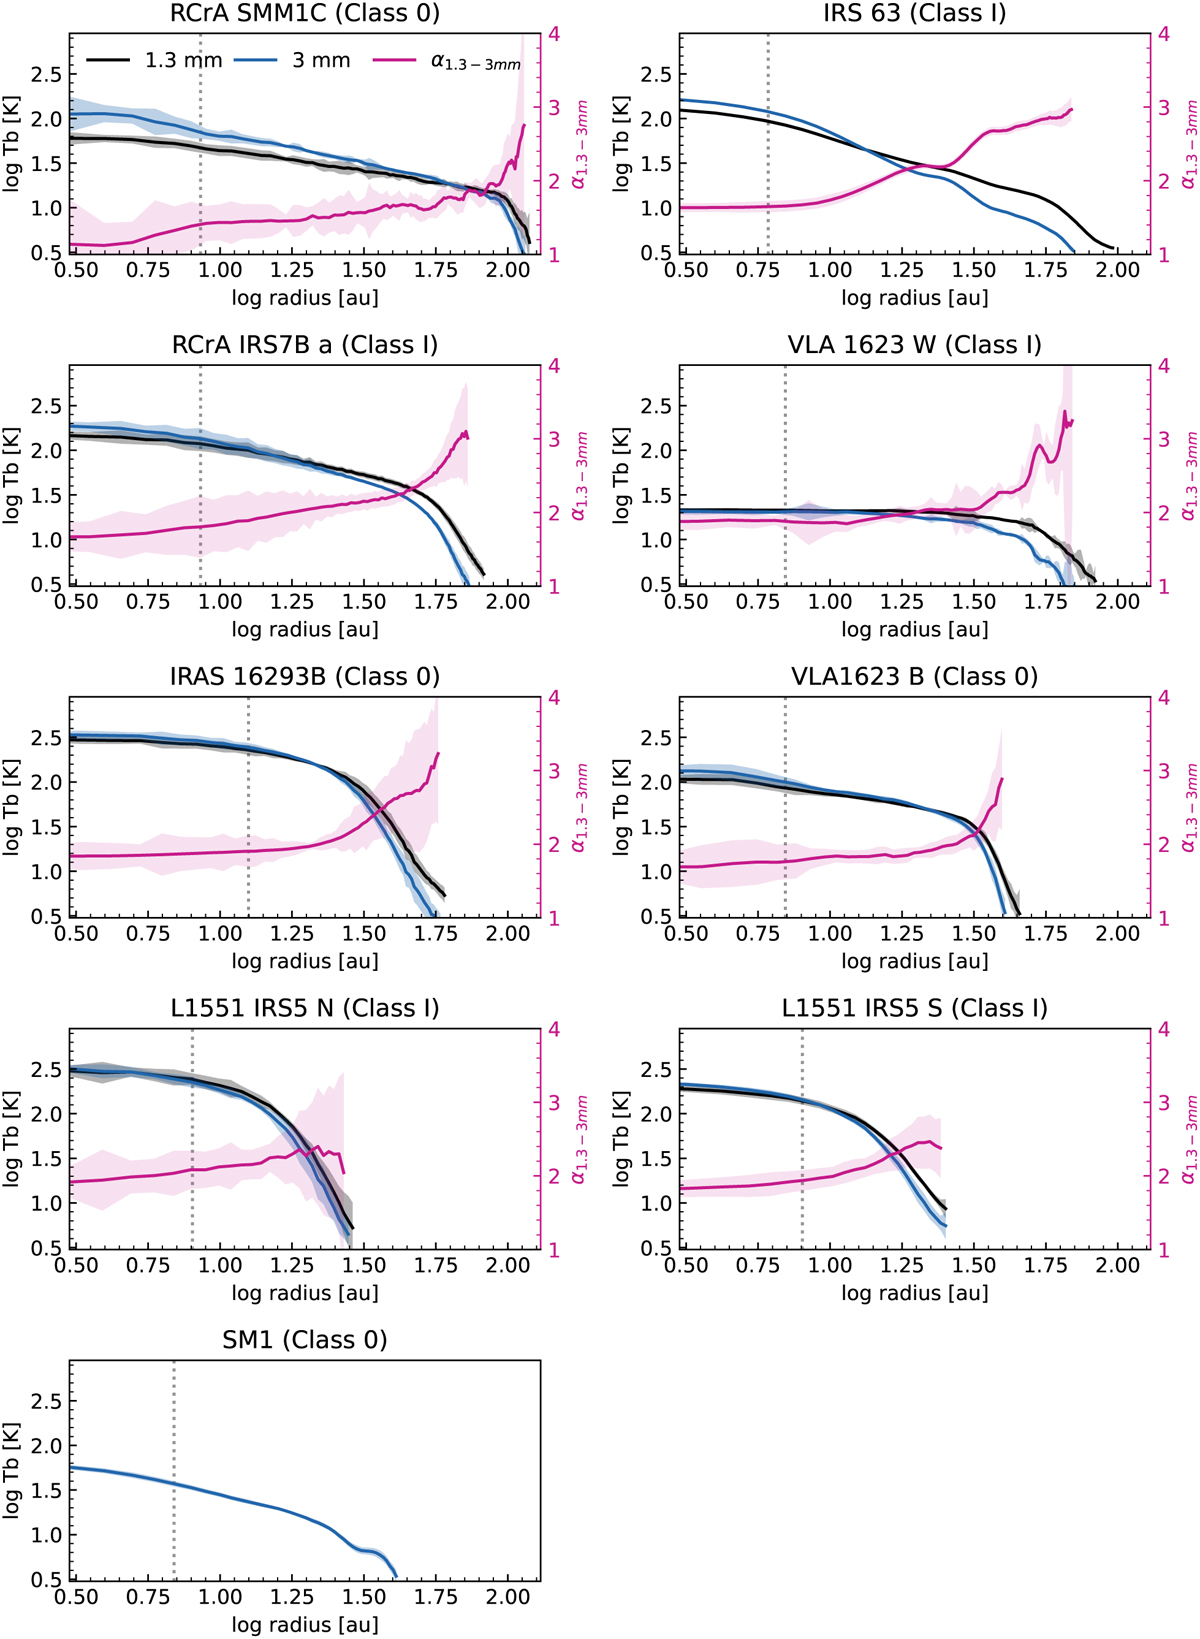
Intensity profiles on logarithmic scales at 1.3 and 3 mm expressed in brightness temperature, calculated using the full Planck function. The shaded area corresponds to the uncertainty in the mean (Section 4.3). The 1.3–3 mm spectral index α calculated from the profiles is shown in magenta with the corresponding value in the right y-axis. The magenta shaded area shows the uncertainty calculated propagating the errors in the intensity profiles. The vertical dotted line represents the geometric mean of the beam size, indicating that emission beyond this point is spatially well resolved.
Current usage metrics show cumulative count of Article Views (full-text article views including HTML views, PDF and ePub downloads, according to the available data) and Abstracts Views on Vision4Press platform.
Data correspond to usage on the plateform after 2015. The current usage metrics is available 48-96 hours after online publication and is updated daily on week days.
Initial download of the metrics may take a while.